
|
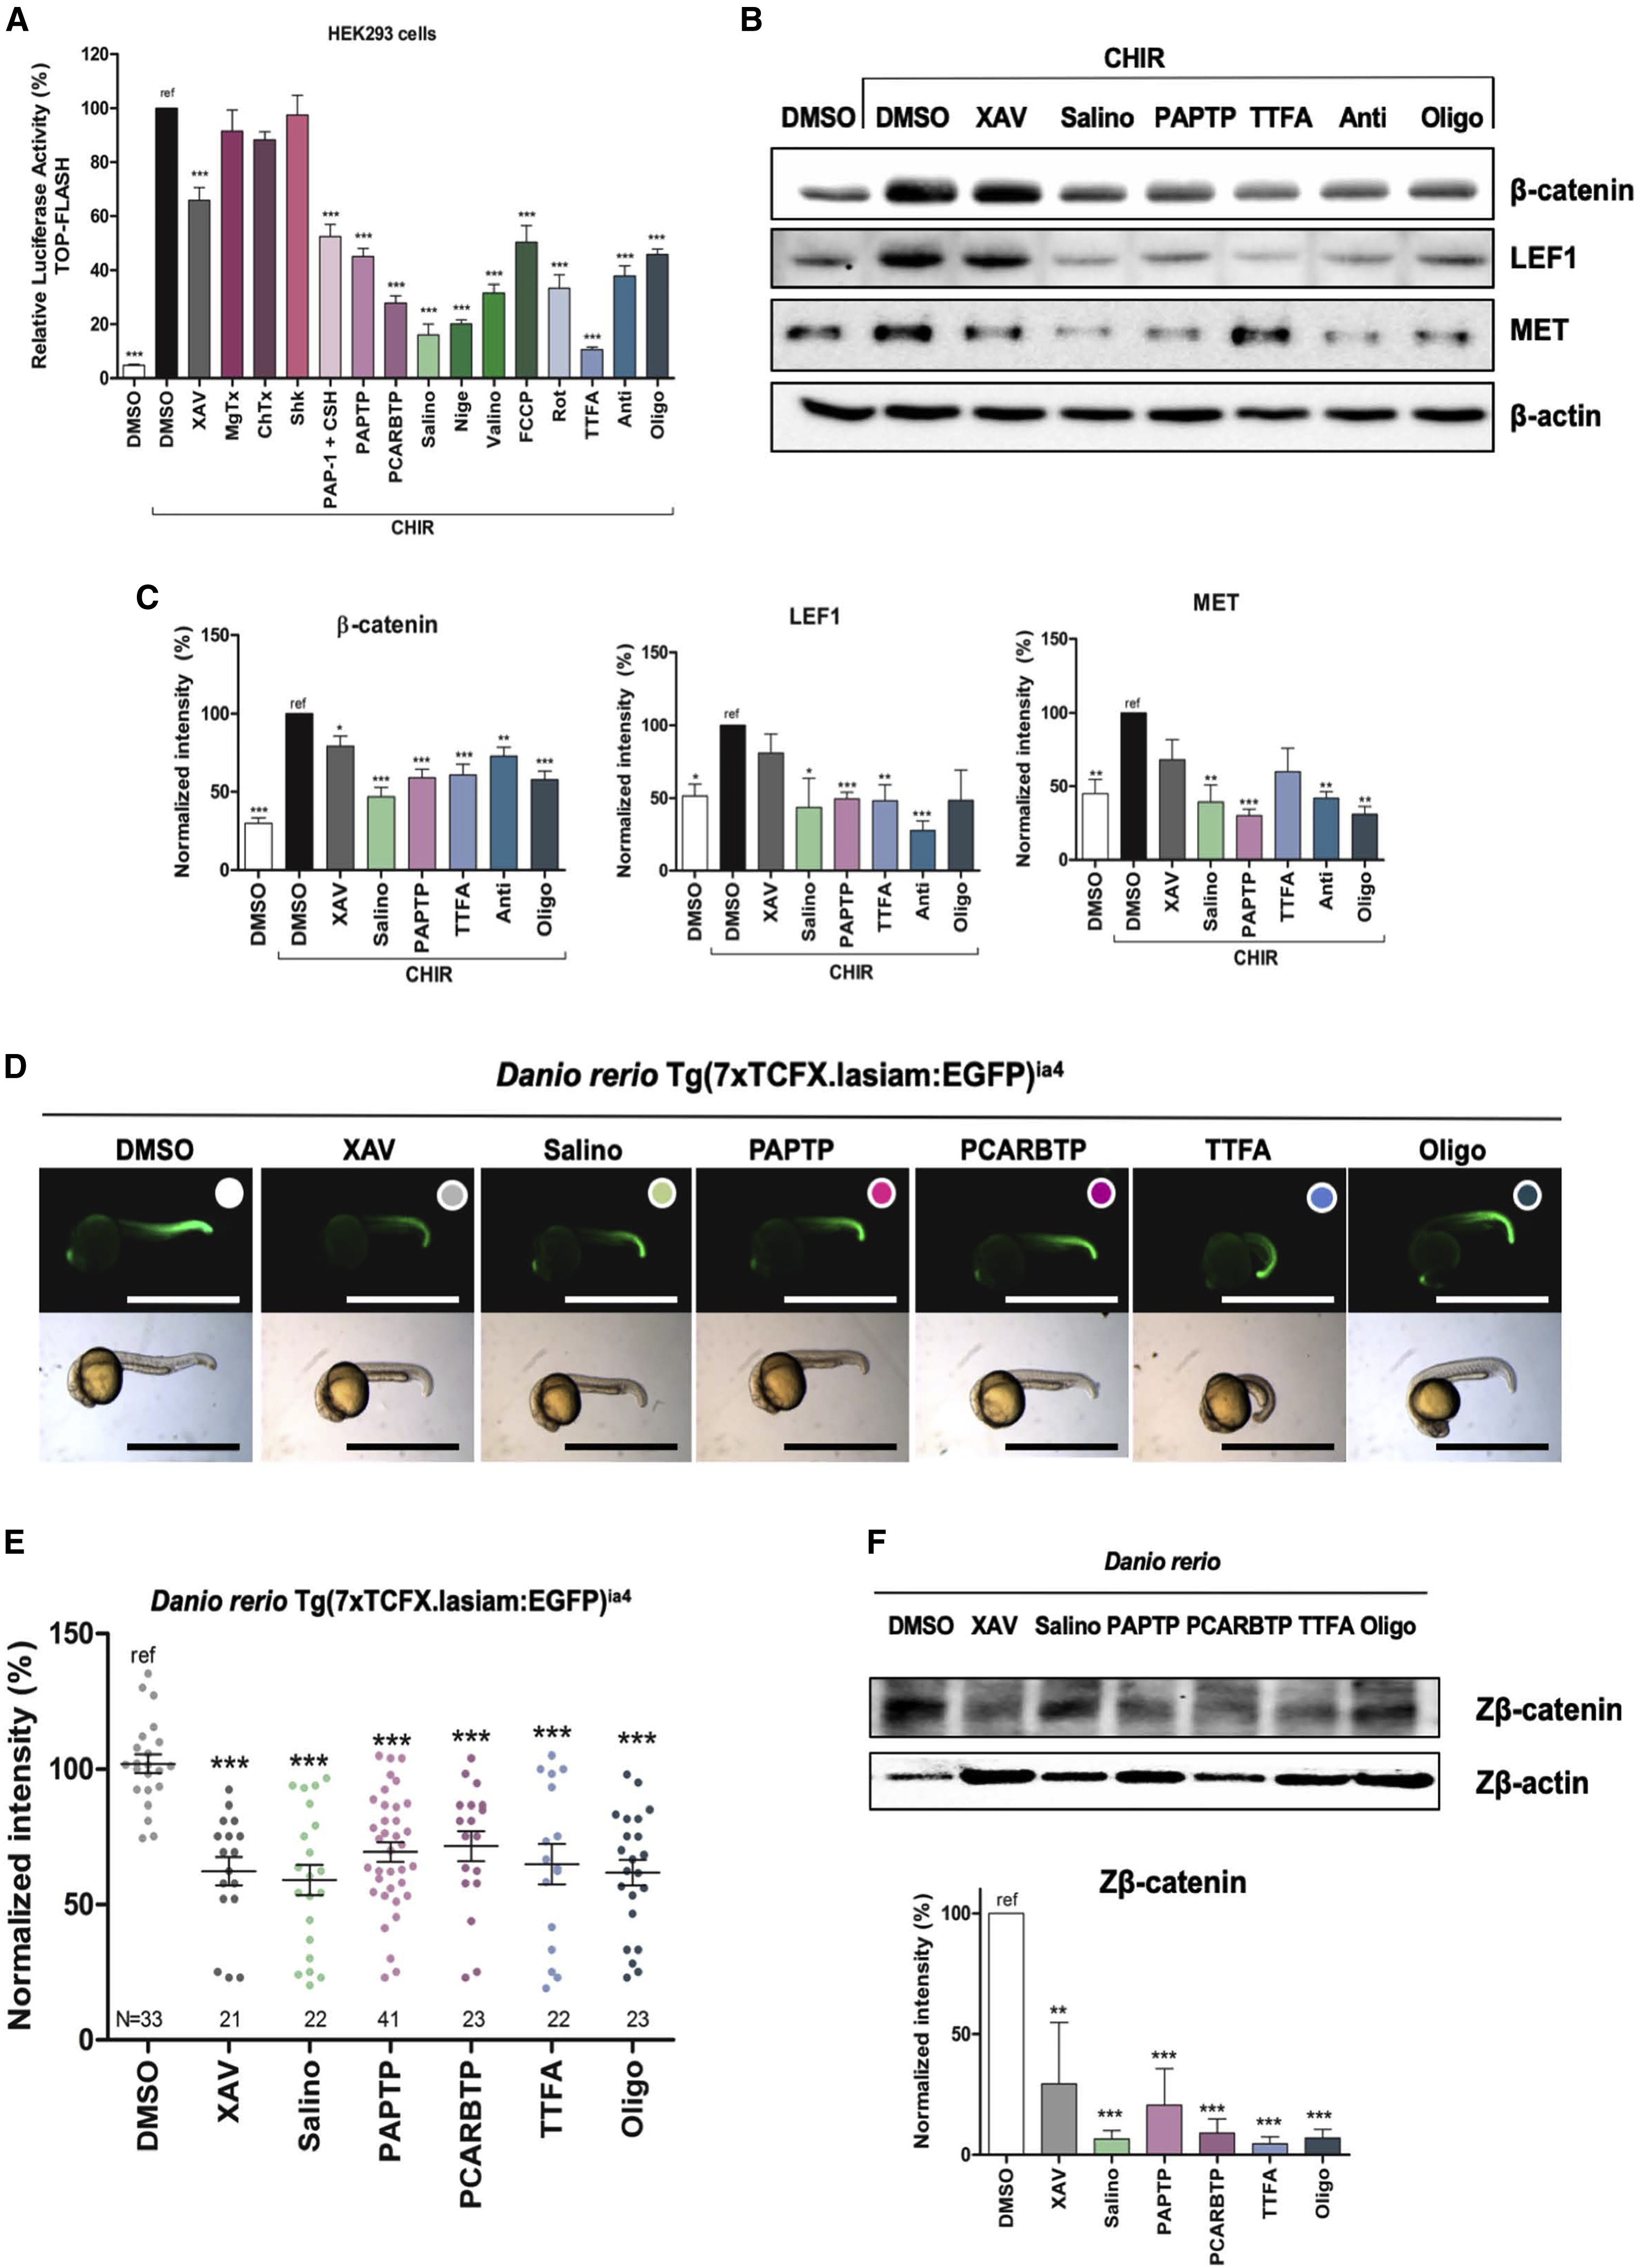
Fig. 1
Mitochondrial Fitness Fine-Tunes Wnt Signaling in Human Embryonic Kidney HEK293 Cells and in Wnt-Dependent Reporter Zebrafish
(A) Canonical Wnt signaling activity based on TCF-LEF-dependent transcription was assayed in HEK293 cells. These cells were either left untreated or Wnt signaling was enhanced using 3 μM CHIR99021 (CHIR). Cells were then treated for 8 h with the following compounds: 0.1% DMSO, as negative control; 10 μM XAV939 (XAV) as positive control; MgTx, ShK, ChTx (1 μM); PAP-1 (20 μM) + cyclosporin H (CSH) (4 μM); 1 μM PAPTP, 5 μM PCARBTP; 5 μM salinomycin (Salino), 0.5 μM nigericin (Nige), 1 μM valinomycin (Valino); and 2 μM FCCP; 5 μM rotenone (Rot), 0.5 mM TTFA, 1.8 μM antimycin A (Anti), and 1.2 μM oligomycin (Oligo). The luciferase signal was normalized with respect to the signal given by β-gal, which was co-transfected with TOPflash plasmid. The values are reported as the percentage of luciferase signal related to the “ref.” Values are means ± SEMs (n = 8).
(B and C) Reduction of protein levels of β-catenin and its target genes LEF1 and MET are shown in representative western blots (B). Densitometric analysis (n = 6; means ± SEMs) is reported in (C).
(D and E) GFP fluorescent zebrafish Tg(7xTCFX.lasiam:EGFP)ia4 Wnt-dependent reporter fishes were treated for 15 h with the following compounds: DMSO 0.2%, 20 μM XAV, 1 μM Salino, 1.5 μM PAPTP, 5 μM PCARBTP, 50 μM TTFA, and 0.12 μM Oligo. Representative bright-field and epifluorescence microscopy images are reported in (D), while fluorescence quantification is shown in (E) (means ± SEMs). The numbers reported on the graph represent the number of zebrafish embryos treated for each condition. Bars, 1.5 mm.
(F) Zebrafish β-catenin (Zβ-catenin) protein level from embryos treated as (D) and (E) was determined by western blot. The quantification is reported below. The values are indicated as the percentage of the “ref” (n = 3; means ± SEMs).
Statistical significance (ANOVA) was determined as ∗p < 0.05, ∗∗p < 0.01, and ∗∗∗p < 0.001.