
|
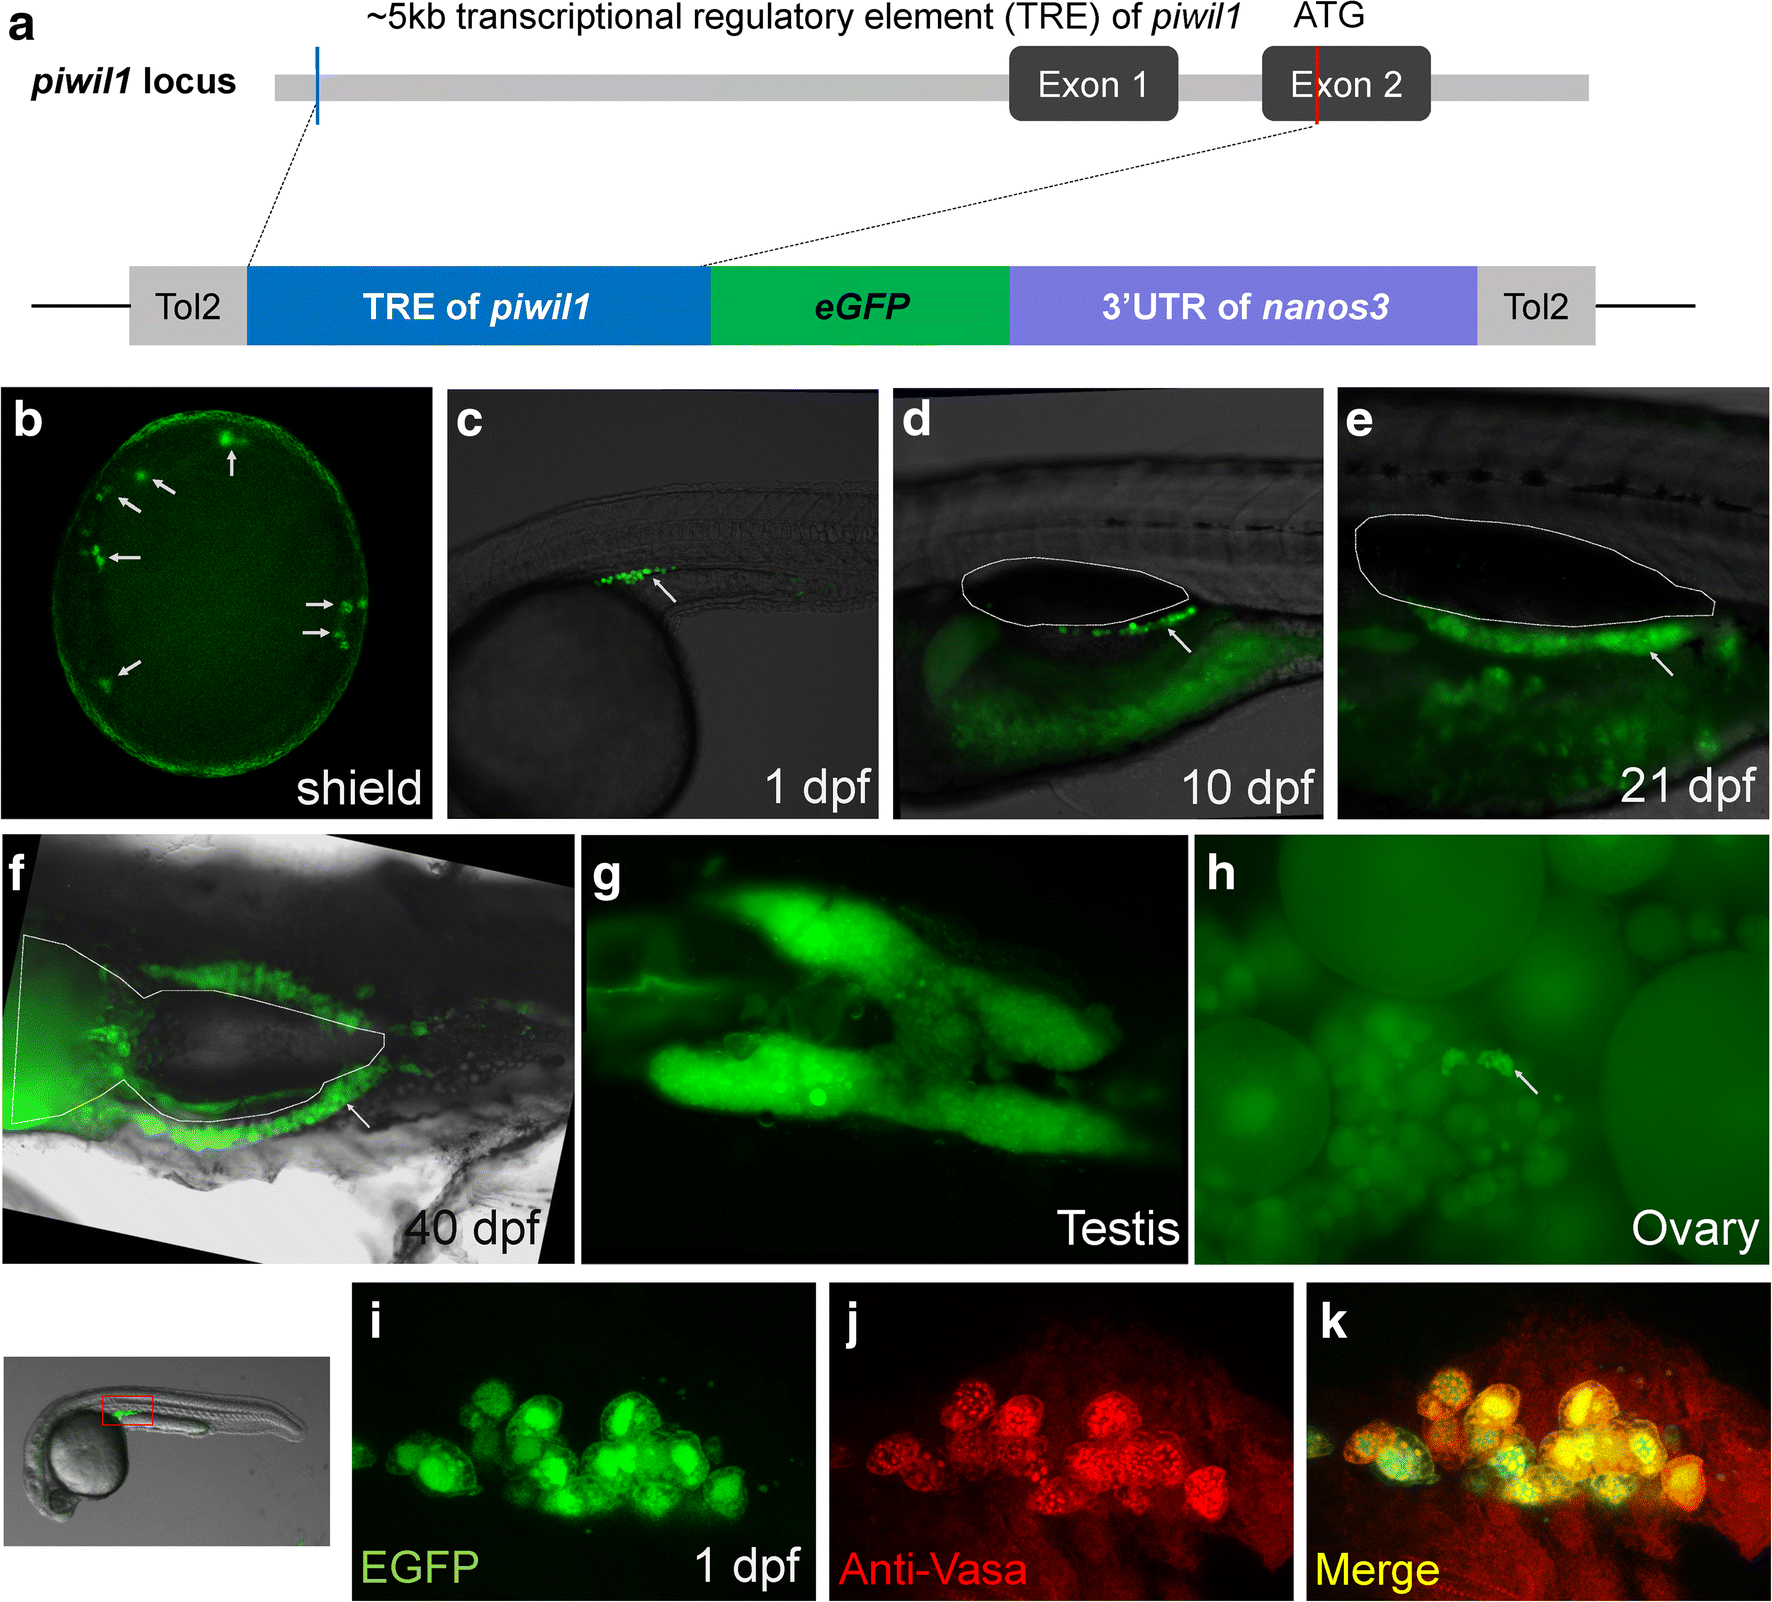
Fig. 1
Generation and characterization of Tg(piwil1:egfp-UTRnos3)ihb327Tg. a The structure of the transcriptional regulatory region of piwil1 locus of zebrafish and the sketch map of transgenic elements. b–h Germ cell-specific expression at various developmental stages as indicated in the figure (arrows indicate the EGFP-positive germ cells; outlines indicate the swim bladder). g Dissected adult testis. h Dissected adult ovary (arrows indicate EGFP-positive oogonia or early stage of oocytes). i–k Immunofluorescence of Vasa in the transgenic embryo at 1 dpf. The selected region for imaging is indicated by a red box. iEGFP; j anti-Vasa; k merged channel
|
Construct:
Tg(piwil1:EGFP-UTRnanos3)
|