Fig. S2
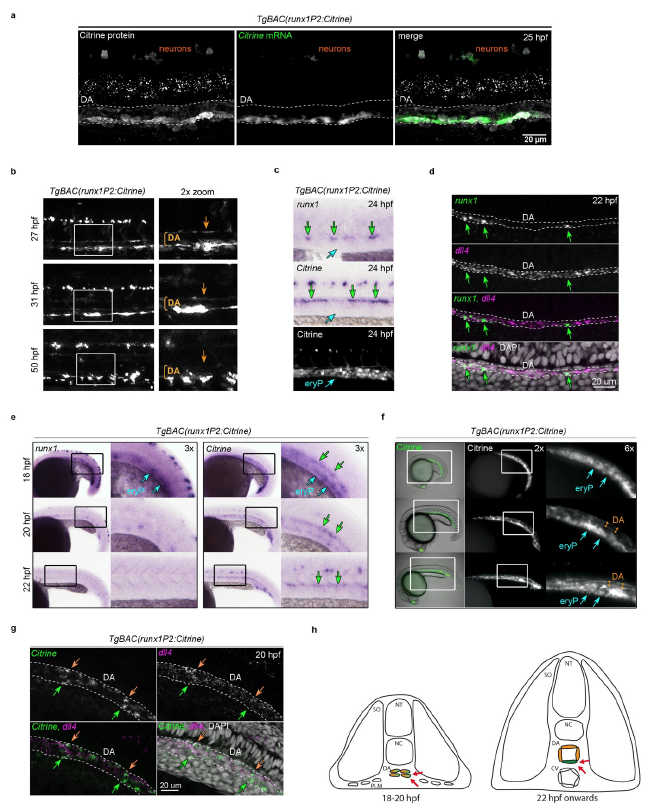
Initial activation of Citrine expression before DA lumenisation causes carry over of Citrine protein in the aortic roof endothelium (a) Confocal image of a whole mount 25 hpf TgBAC(runx1P2:Citrine) embryo immunostained for Citrine protein (white) combined with FISH for Citrine mRNA (green). The DA structure is outlined. (b) Analysis of Citrine transgene and endogenous runx1 expression in 24 hpf TgBAC(runx1P2:Citrine) embryos by ISH (runx1 and Citrine) and fluorescent microscopy (Citrine). Green arrows point to the HE. Blue arrows point to the sub-aortic region containing primitive erythrocytes (eryP). (c) Representative fluorescent microscopic images of the DA region from TgBAC(runx1P2:Citrine) embryos over time. Image acquisition was performed under identical illumination conditions. The magnifications highlight the boxed regions. Orange arrows point to the DA roof. (d) Maximum intensity projection of a representative confocal image after double FISH for dll4 and runx1 in the DA region of a 22 hpf embryo. Green arrows point to runx1+ cells. (e) Expression analysis of runx1 and Citrine during early DA development (18-22 hpf) in TgBAC(runx1P2:Citrine) embryos. Left: ISH analysis of runx1. Right: ISH analysis of Citrine. (f) Fluorescent microscopy images of Citrine fluorescence during early DA development (18-22 hpf) in TgBAC(runx1P2:Citrine) embryos. For e and f: blue arrows point to expression in primitive erythrocytes (eryP); green arrows point to the DA/HE region. Orange double-arrows indicate the DA lumen. (g) Maximum intensity projection of a representative confocal image of double FISH for dll4 and runx1 in the DA region of a 20 hpf embryos. orange arrows point to the ARE and green arrows to the HE. (h) Model depicting the DA region of zebrafish embryos before and after lumenisation. DA angioblasts that reach the embryonic midline are initially clustered together. Subsequent lumenisation creates the geometry for a signalling gradient in which the HE (green) stays in the inductive signalling zone (red arrows) driving the up-regulation of haematopoietic genes. ARE (orange) maintains an arterial programme. CV: cardinal vein; DA: dorsal aorta; NC: notochord; NT: neural tube; SO: somites.

