
|
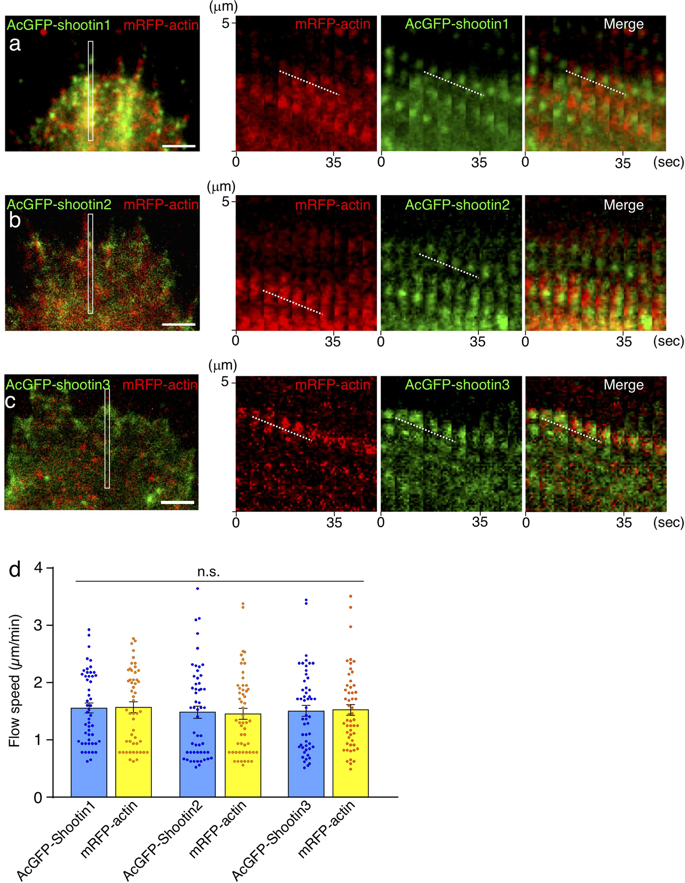
Fig. 2
Zebrafish shootin1, shootin2 and shootin3 interact with F-actin retrograde flow. (a–c) Fluorescent speckle images of AcGFP-shootin1 (a), AcGFP-shootin2 (b) and AcGFP-shootin3 (c) with mRFP-actin in XTC fibroblasts (see Movies 1–3). Kymographs (right) of the areas indicated by rectangles in the left panels show that the fluorescent features of AcGFP-shootin and those of mRFP-actin moved at similar speed (dotted lines). (d) Retrograde flow speeds of shootin1 (n = 51 speckles), shootin2 (n = 54 speckles), shootin3 (n = 53 speckles) and F-actin (n = 107 speckles) measured from the kymograph analysis in (a–c). Scale bars: 2 μm.