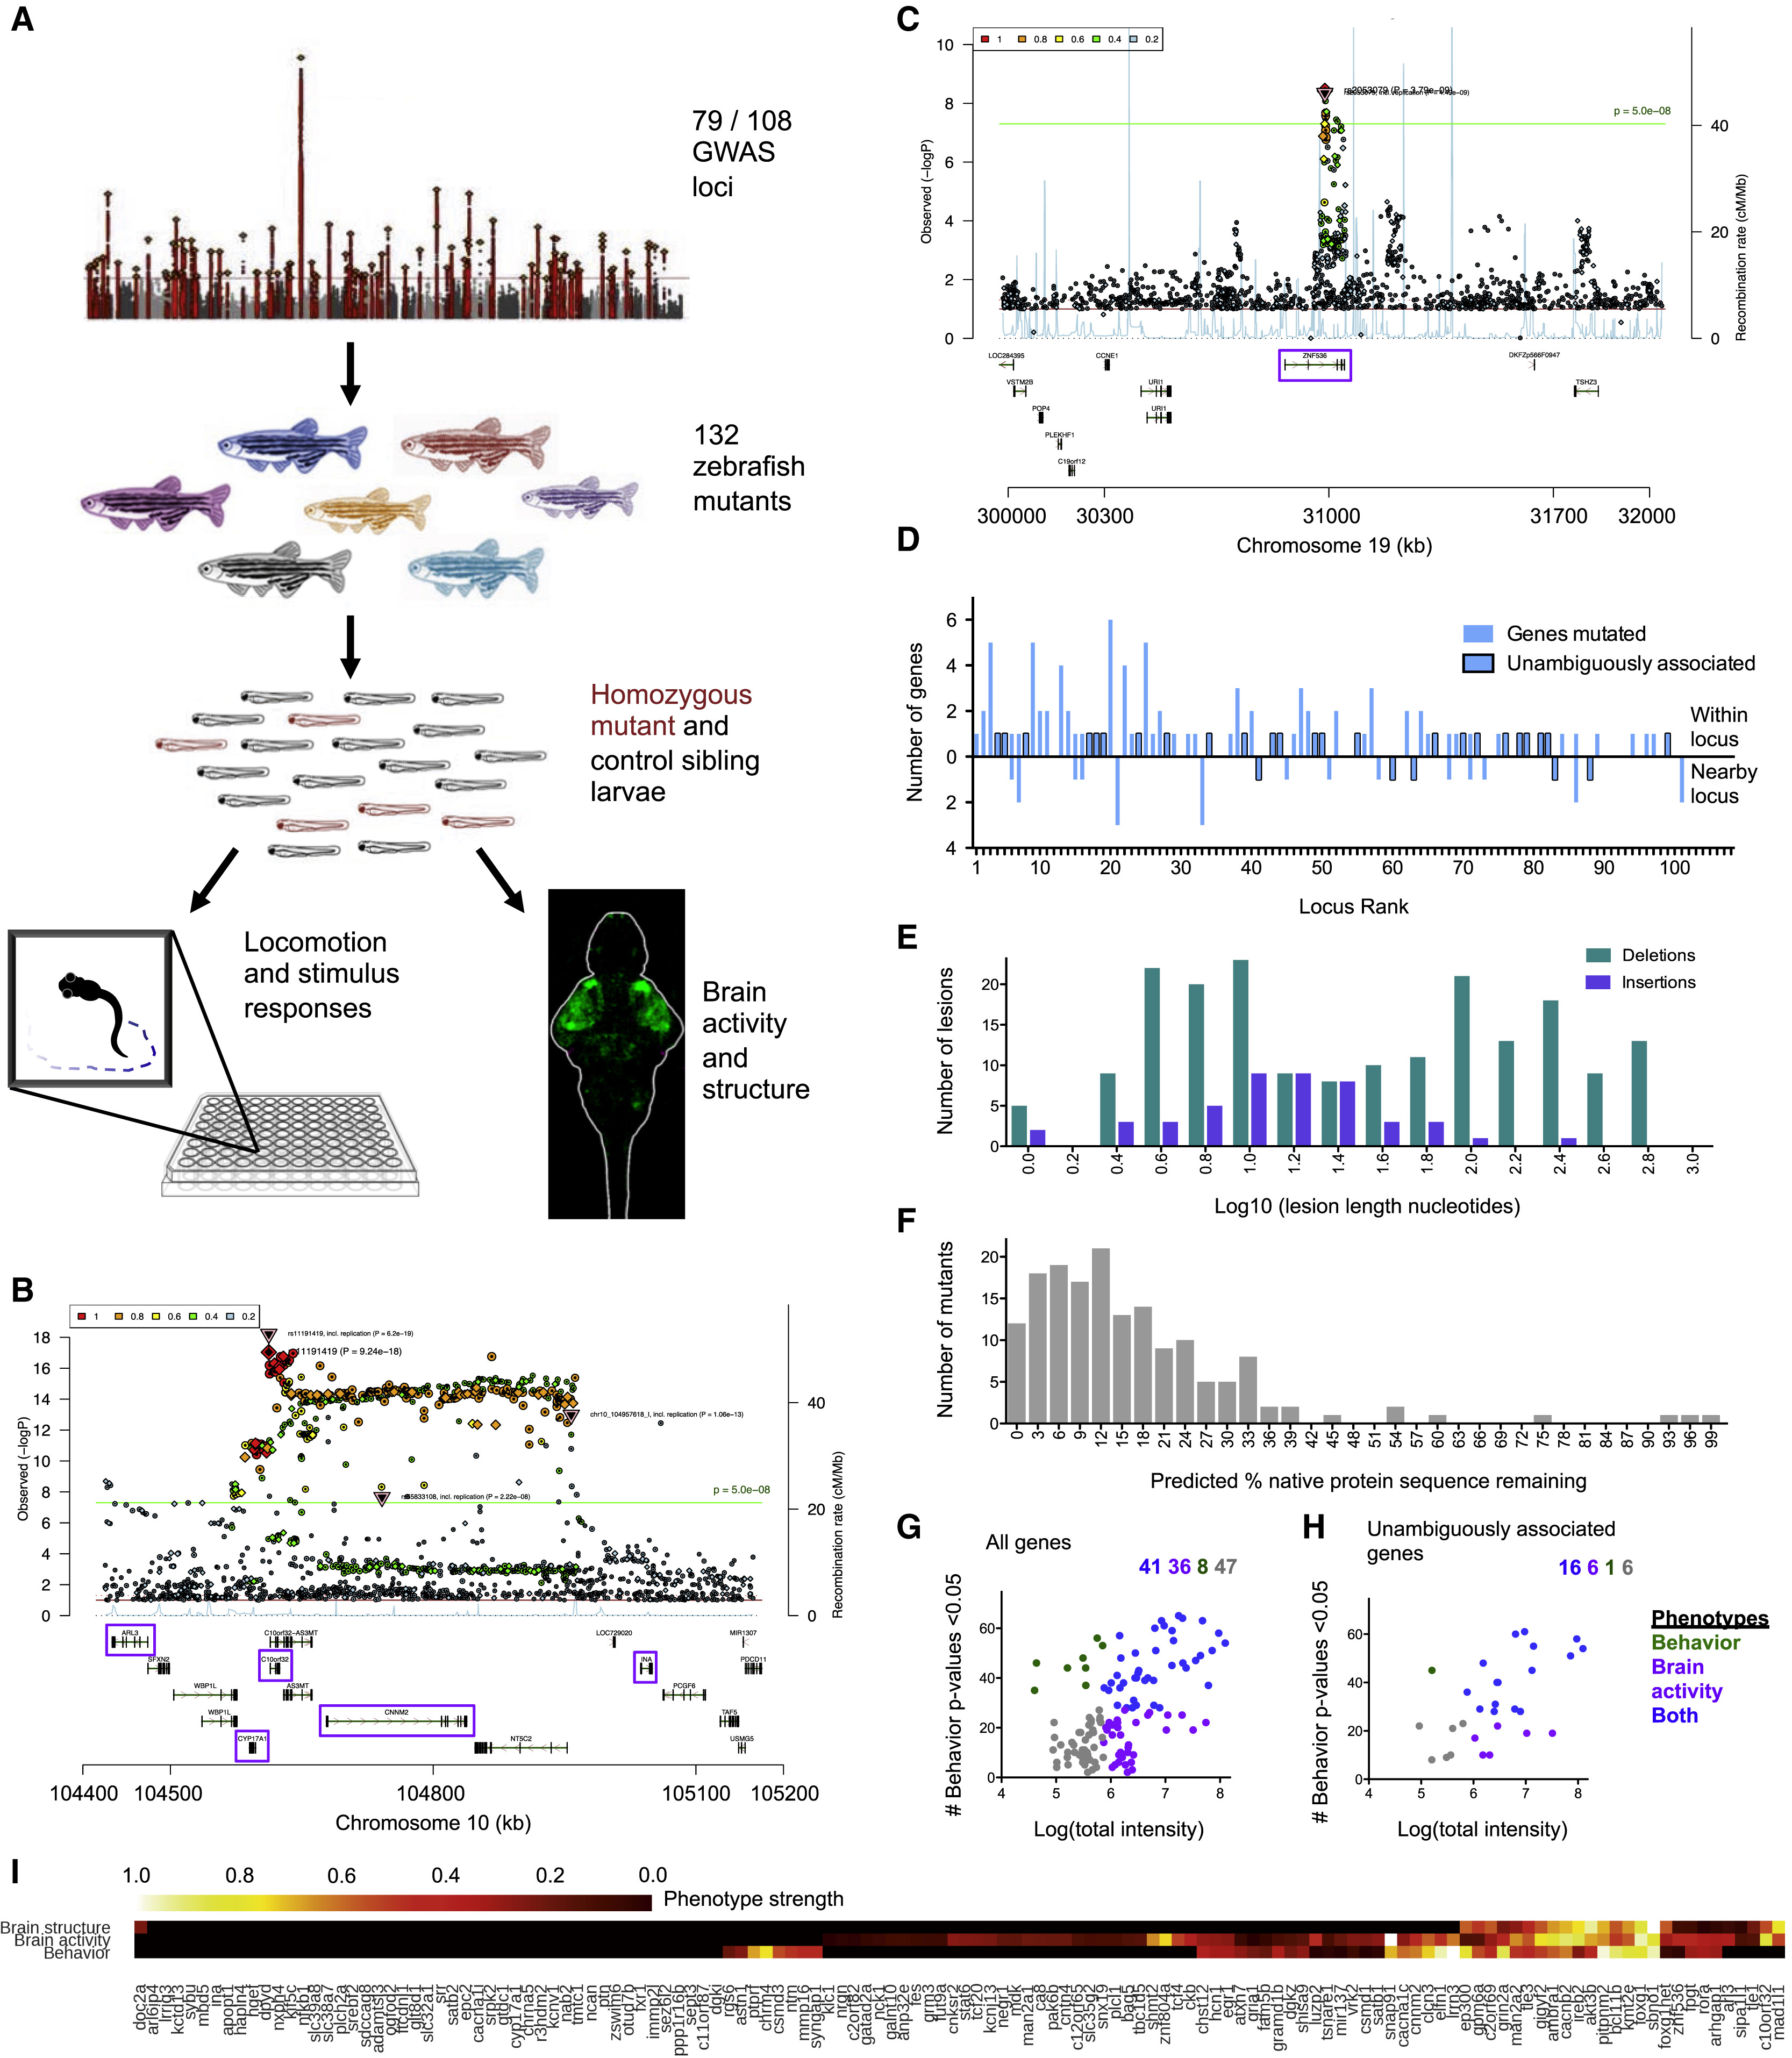
Fig. 1
Generation and Analysis of 132 Mutants for Schizophrenia-Associated Genes
(A) Mutants were generated via Cas9 mutagenesis for genes found within and neighboring genomic loci linked to schizophrenia through genome-wide association. Manhattan plot image was adapted from Schizophrenia Working Group of the Psychiatric Genomics Consortium (2014). The resulting mutants were assessed for changes to brain morphology, brain activity, and behavior. Multiple zebrafishorthologs existed for 33 of the 132 genes (165 individual zebrafish genes), and both copies were mutated and assessed together.
(B) Ricopili plot (https://data.broadinstitute.org/mpg/ricopili/) for multi-gene locus #3 of 108 from which five candidates (purple boxes) were selected for mutagenesis.
(C) Ricopili plot for a gene (znf536) considered unambiguous because there are no other genes within 0.5 megabase on each side of the associated region, and the gene within the association region is brain-expressed.
(D) Mutants made from 79 of 108 associated genomic loci. The locus rank reflects the statistical strength of the genetic association, with 1 being the most significantly associated. A region of 0.5–2 MB around each locus was analyzed, and genes outside of the region of linkage disequilibrium were selected for 19 of the 79 loci. Unambiguously associated genes are implicated strongly by previous literature, such as genes involved in glutamatergic neurotransmission, or are the only genes within or neighboring their locus (Table S1).
(E) Mutations generated from Cas9 cleavage. Some mutant alleles consisted of several lesions if multiple gRNAs cleaved the genome independently, and all are included here. A range of mutations was recovered, tending to be either small (<15 bases) when a single gRNA cleaved or large (>100 bases) when a deletion spanned target sites of multiple gRNAs.
(F) Protein sequence predicted to remain in mutants, based on sequence alignment identity. This analysis included both orthologs if the gene was duplicated (33 genes), for a total of 165 individual genes (163 in graph, as it does not include mir137 and one gene with unclear wild-type protein sequence length). The four mutants with >75% of the protein remaining did not have frameshifting mutations but did have phenotypes (Table S2), indicating that the protein function was disrupted.
(G) Phenotypes in all 132 mutants based on analysis of brain activity signals and 71 behavioral assessments. See also Figure S1 and Figure S2for the cutoffs for classifying which mutants have phenotypes.
(H) Phenotypes in mutants for the 29 unambiguously associated genes (Table S1).
(I) Phenotype dimensions affected in mutants for 132 genes from 79 schizophrenia-associated loci. Quantification of brain activity, brain structure, and behavioral differences for mutants designated as having a phenotype (Figure S1, Figure S2, Figure 1G, Figure 3B, Table S2) was scaled for comparison between the three measures, with the weakest phenotype designated as 0 and strongest as 1. Measures below the cutoff for phenotype designation (Figure S1, Figure S2) are displayed in black.
Reprinted from Cell, 177(2), Thyme, S.B., Pieper, L.M., Li, E.H., Pandey, S., Wang, Y., Morris, N.S., Sha, C., Choi, J.W., Herrera, K.J., Soucy, E.R., Zimmerman, S., Randlett, O., Greenwood, J., McCarroll, S.A., Schier, A.F., Phenotypic Landscape of Schizophrenia-Associated Genes Defines Candidates and Their Shared Functions, 478-491.e20, Copyright (2019) with permission from Elsevier. Full text @ Cell

