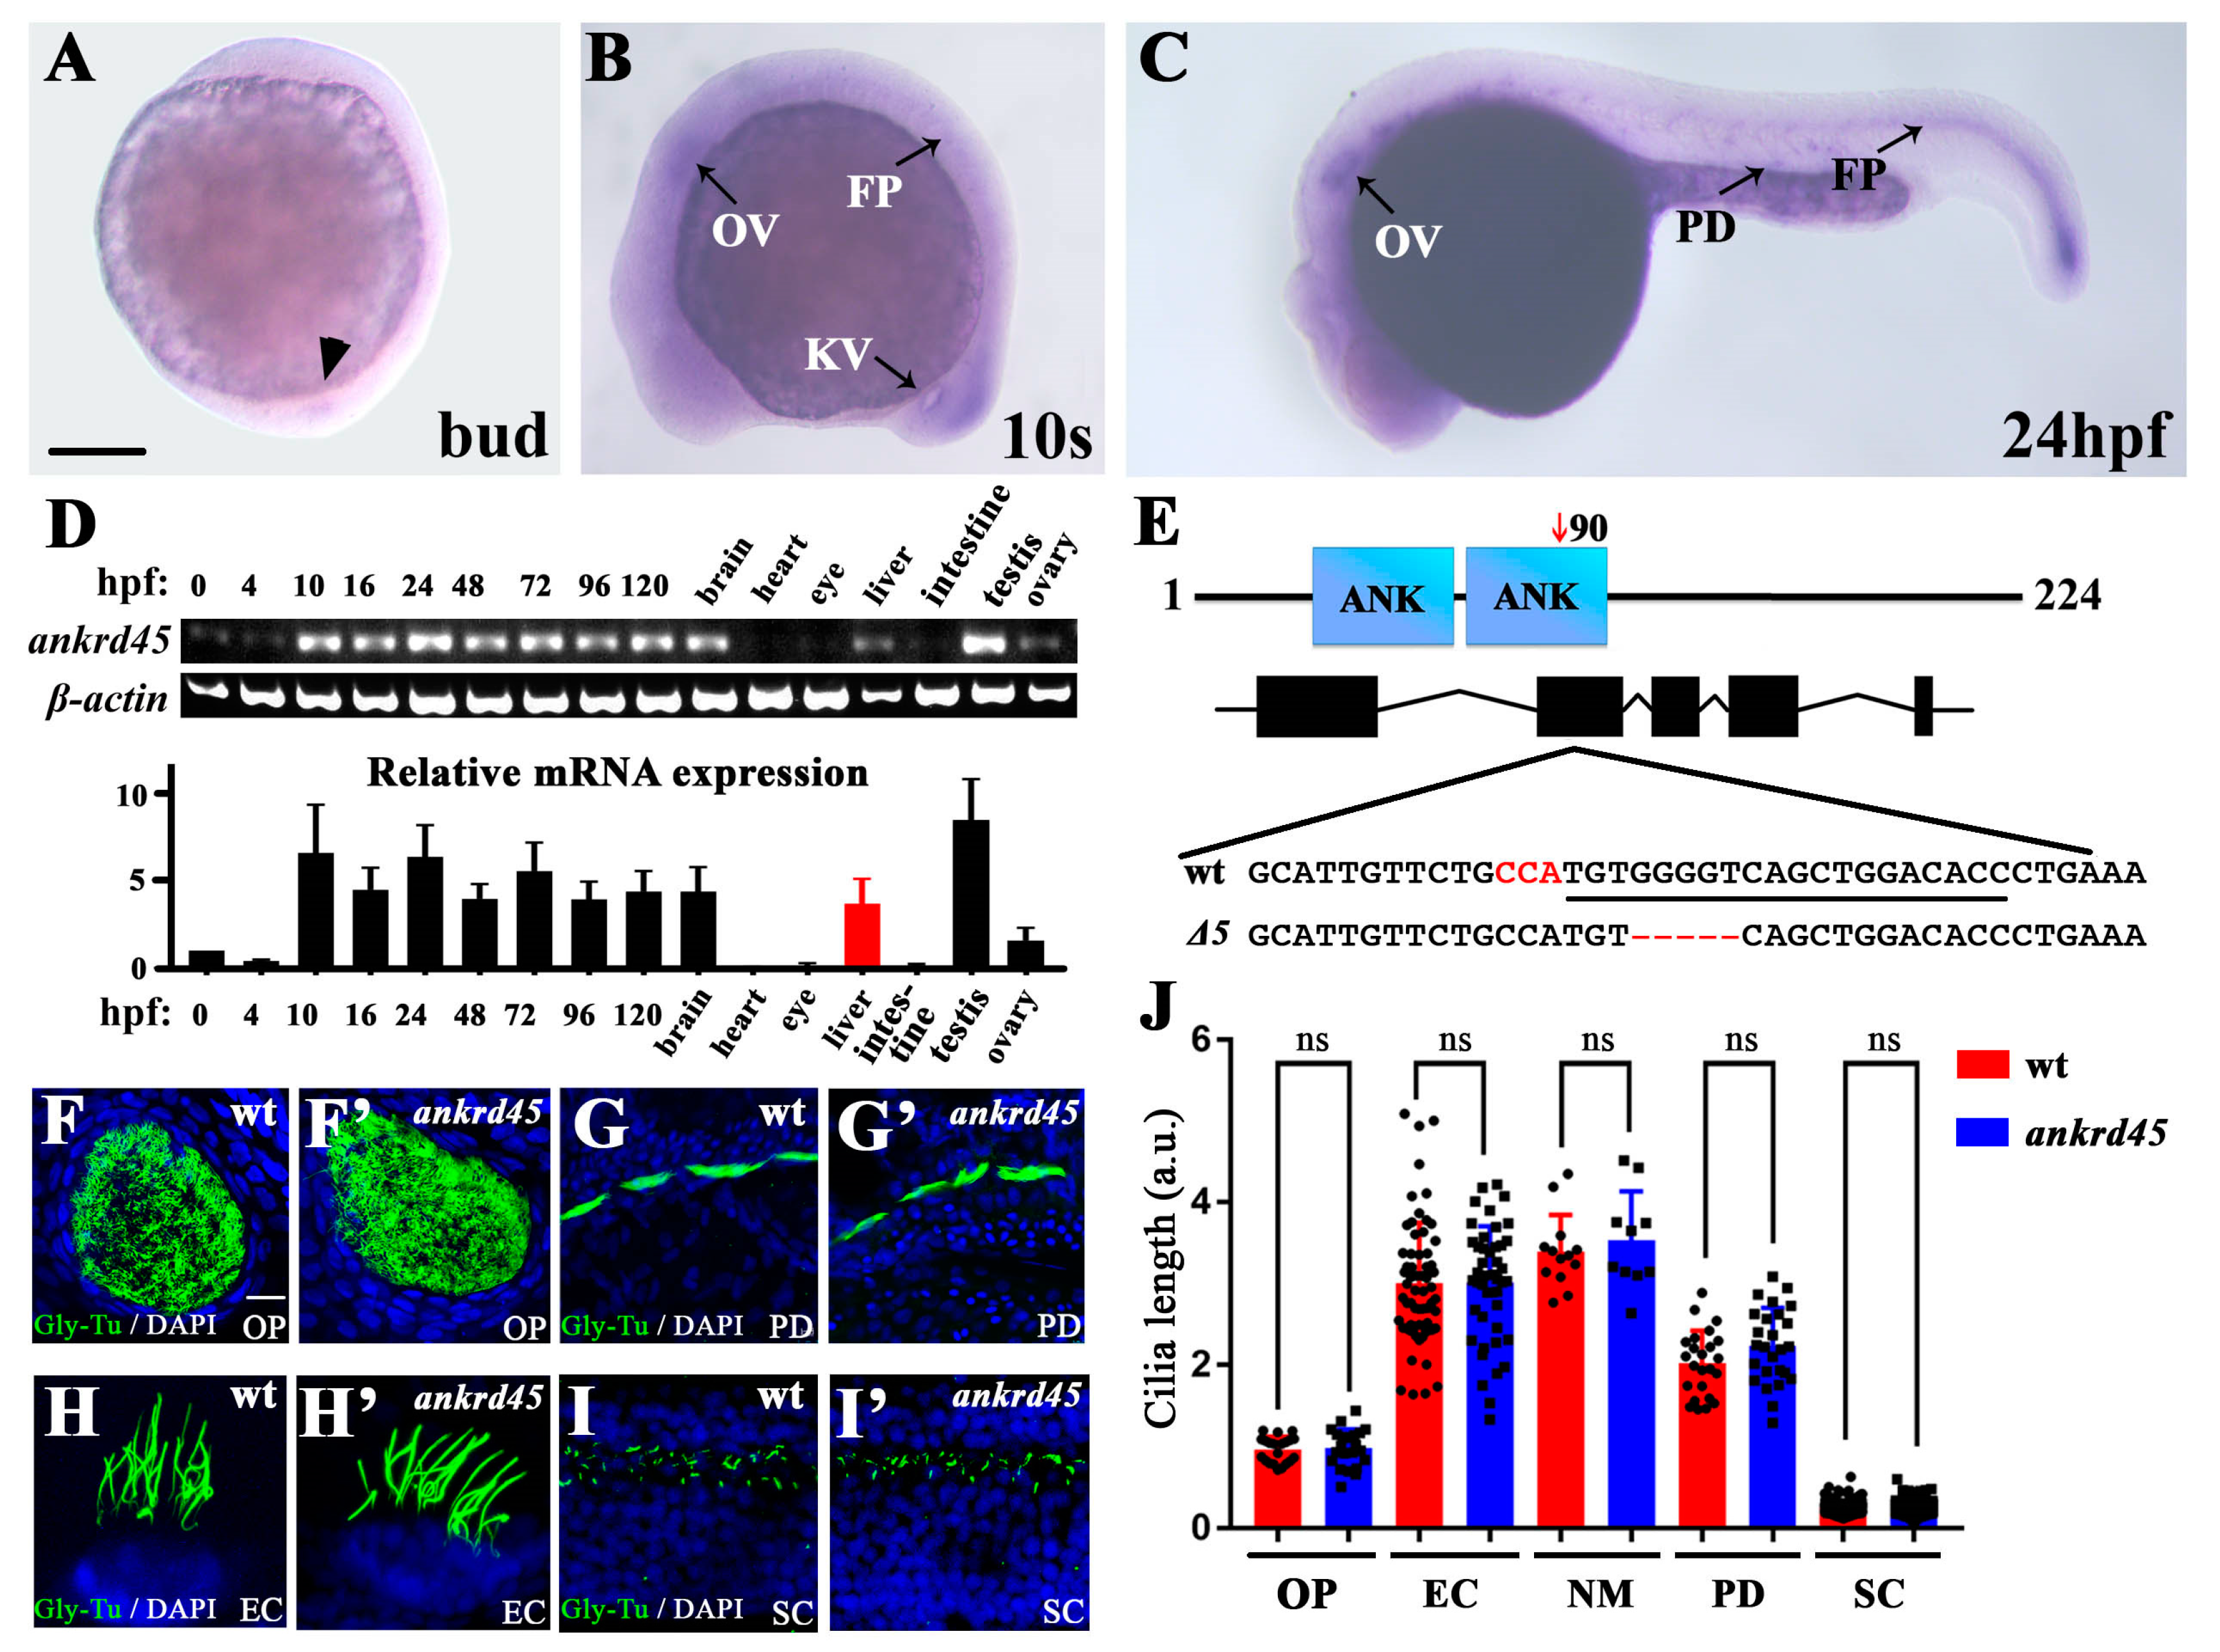
Fig. 1
Expression pattern of ankrd45 and cilia development in ankrd45 mutants. (A–C) Whole-mount in situ hybridization results showing the expression of ankrd45 at different stages. (A) At the bud stage, ankrd45 is expressed in the dorsal forerunner cells (arrowhead). (B) At the 10-somite stage, ankrd45 is expressed in the otic vesicle (OV), Kupffer’s vesicle (KV), and floor plate (FP). (C) ankrd45 is enriched in the otic vesicle, the pronephric duct (PD), and the floor plate at 24 hpf. (D) Real-time PCR showing the expression of ankrd45 at different stages or adult tissues as indicated. Bottom: bar graph showing the relative expression levels of ankrd45 at different stages or adult tissues as indicated. (E) Diagram showing the genomic structure of the zebrafish ankrd45 gene. Bottom shows the sequences of wild-type and mutant alleles (Δ5). Underlined sequence indicates the spCas9 target region, and the PAM sequence is indicated in red. (F–I’) Confocal images showing the cilia in the olfactory pit (F,F’), pronephric duct (G,G’), ear cristae (H,H’), and spinal cord (I,I’) in wild-type or mutant larvae visualized with anti-glycylated tubulin antibody. (J) Bar graph showing the length of cilia per arbitrary unit (a.u.) in different organs as indicated. OP, olfactory pit; EC, ear cristae; SC, spinal cord; NM, neuromast. Scale bars: 200 μm in A–C; 20 μm in F–I’. ns, not significant.

