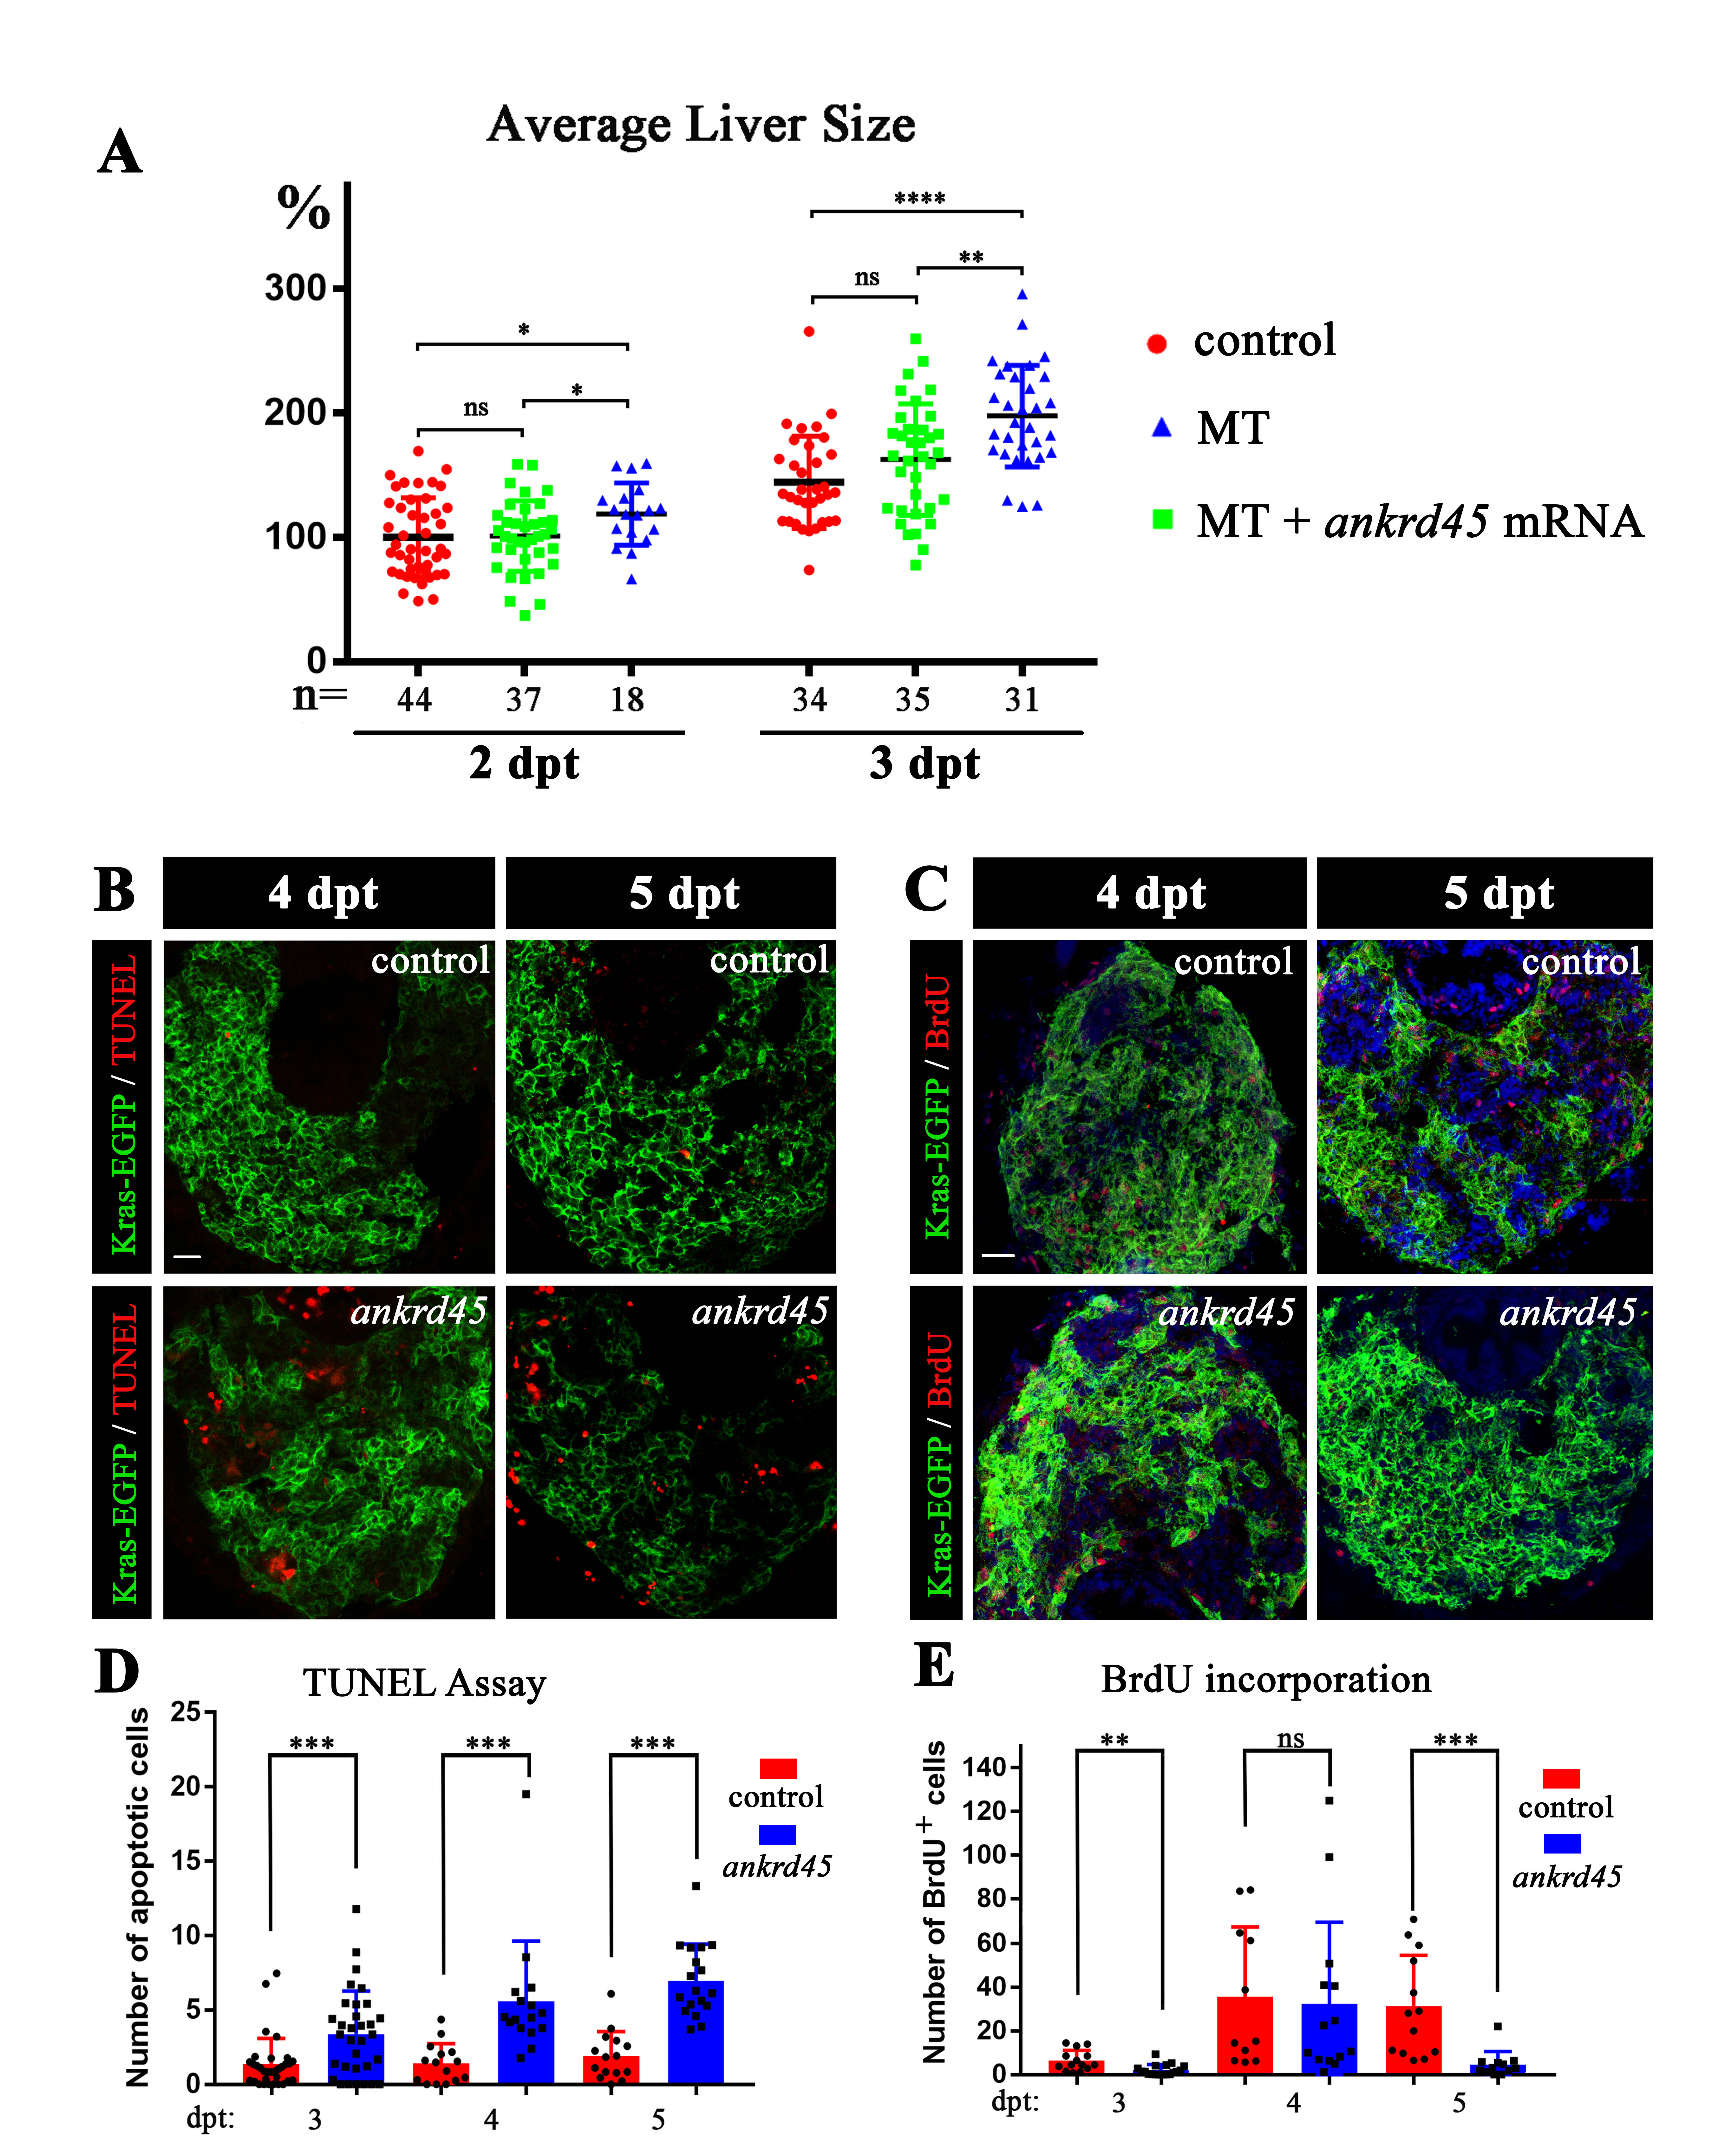
Fig. S2
. Liver-specific induction of KrasG12V in ankrd45 mutant
(A) Dotted graph showing the average size of liver in different groups as indicated. Ectopic expression of Ankrd45 inhibited the overgrowth of liver in the homozygous mutants (MT). The number of embryos examined was shown in the bottom. (B) Confocal images showing the apoptotic cells stained by TUNEL assay at 4 and 5 days after treatment. (C) Confocal images showing proliferating cells visualized by BrdU incorporation assay. (D) Statistical results of apoptotic cells at different time point after doxycycline treatment in the liver of control and ankrd45 larvae. (E) Statistical results showing the number of BrdU positive cells at different time point after doxycycline treatment. Scale bars, 25 μm.

