
|
Fig. S4
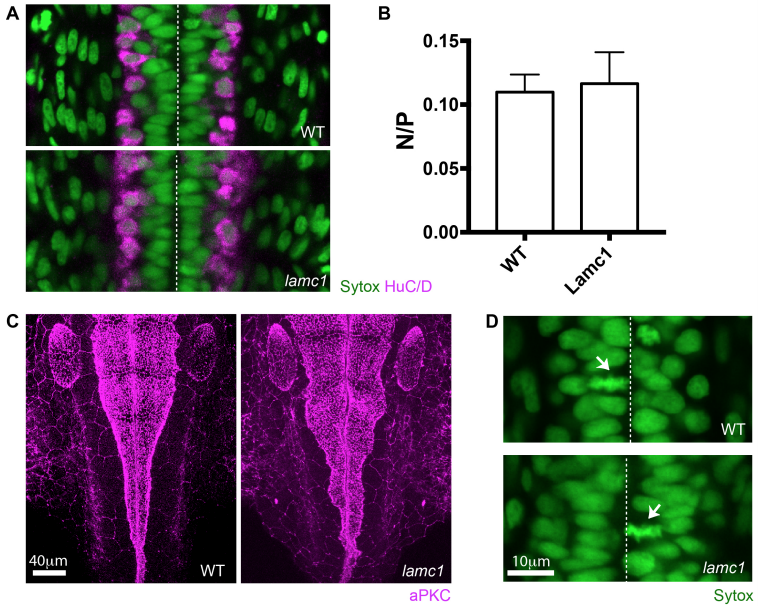
Lamc1 mutant characterization (related to Figure 6). A) Dorsal view of spinal cord in wild type and lamC1 mutant embryos. HuC/D immunoreactivity (magenta) reveals the position of spinal cord neurons at 24 hpf. B) Graph showing the ratio of neurons to progenitors in wild type and lamC1 mutant spinal cords at 24 hpf (mean ± SD, 0.11 ± 0.01 for wild type and 0.12 ± 0.02 for lamc1 mutant, unpaired one-tailed t-test p=0.4428). C) Dorsal view of wild type and lamC1 mutant embryos at the hindbrain. aPKC immunoreactivity (magenta) shows the position of the apical surfaces at 28 hpf. D) Dorsal view of spinal cord in wild type and lamC1 mutant embryos showing apical mitoses (arrows). Dashed line shows position of the apical surfaces in A) and D). Nuclei labelled by Sytox in A) and D).
Reprinted from Developmental Cell, 49, Hadjivasiliou, Z., Moore, R.E., McIntosh, R., Galea, G.L., Clarke, J.D.W., Alexandre, P., Basal Protrusions Mediate Spatiotemporal Patterns of Spinal Neuron Differentiation, 907-919.e10, Copyright (2019) with permission from Elsevier. Full text @ Dev. Cell