
Image
|
Figure Caption
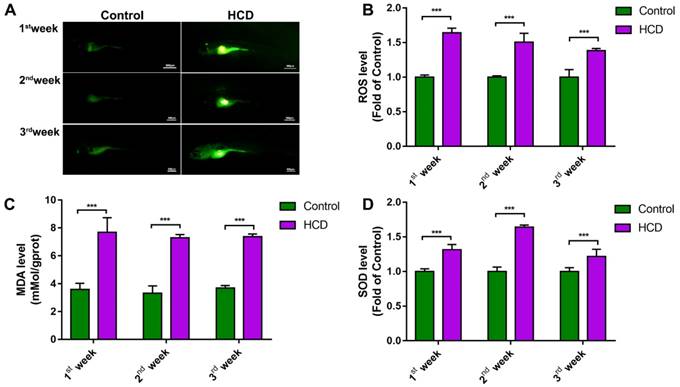
Fig. 2
Effect of high cholesterol diet on metabolic oxidant stress in larval zebrafish. (A) ROS production of Larval zebrafish stained by DCFH-DA and captured by fluorescence stereoscope (B) Quantitation of ROS level (n=6). (C) MDA level of larval zebrafish (n=6) (D) SOD activity of larval zebrafish (n=6). Bar indicate means ± SD. ***P<0.001 represent significance of difference, P<0.05 was considered as statistically significant. Significant was calculated by ANOVA followed by turkey's test. n indicates the replicates of experiment.
Figure Data
Acknowledgments
This image is the copyrighted work of the attributed author or publisher, and
ZFIN has permission only to display this image to its users.
Additional permissions should be obtained from the applicable author or publisher of the image.
Full text @ Int. J. Biol. Sci.