
|
Figure S2
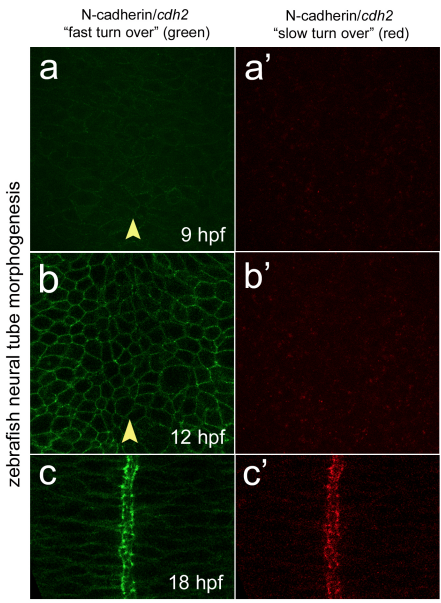
Cdh2 turnover through zebrafish neurulation (a) Dorsal single confocal picture of zebrafish neural plate at 9 hpf showing Cdh2- fast/dynamic “green” turnover in TgBAC(cdh2:cdh2-tFT) 24. (a’) Dorsal single confocal picture of zebrafish neural plate at 9 hpf showing n-cadherin slow/stable “red” turnover in TgBAC(cdh2:cdh2-tFT). (b) Dorsal confocal picture of zebrafish neural plate at 12 hpf showing Cdh2 “green” turnover. (b’) Dorsal confocal picture of zebrafish neural plate at 12 hpf showing Cdh2 “red” turnover. (c) Dorsal confocal picture of zebrafish neural tube at 18 hpf showing Cdh2 “green” turnover. (c’) Dorsal confocal picture of zebrafish neural tube at 18 hpf showing Cdh2 “red” turnover. Arrowhead indicates tissue midline