Fig. 7
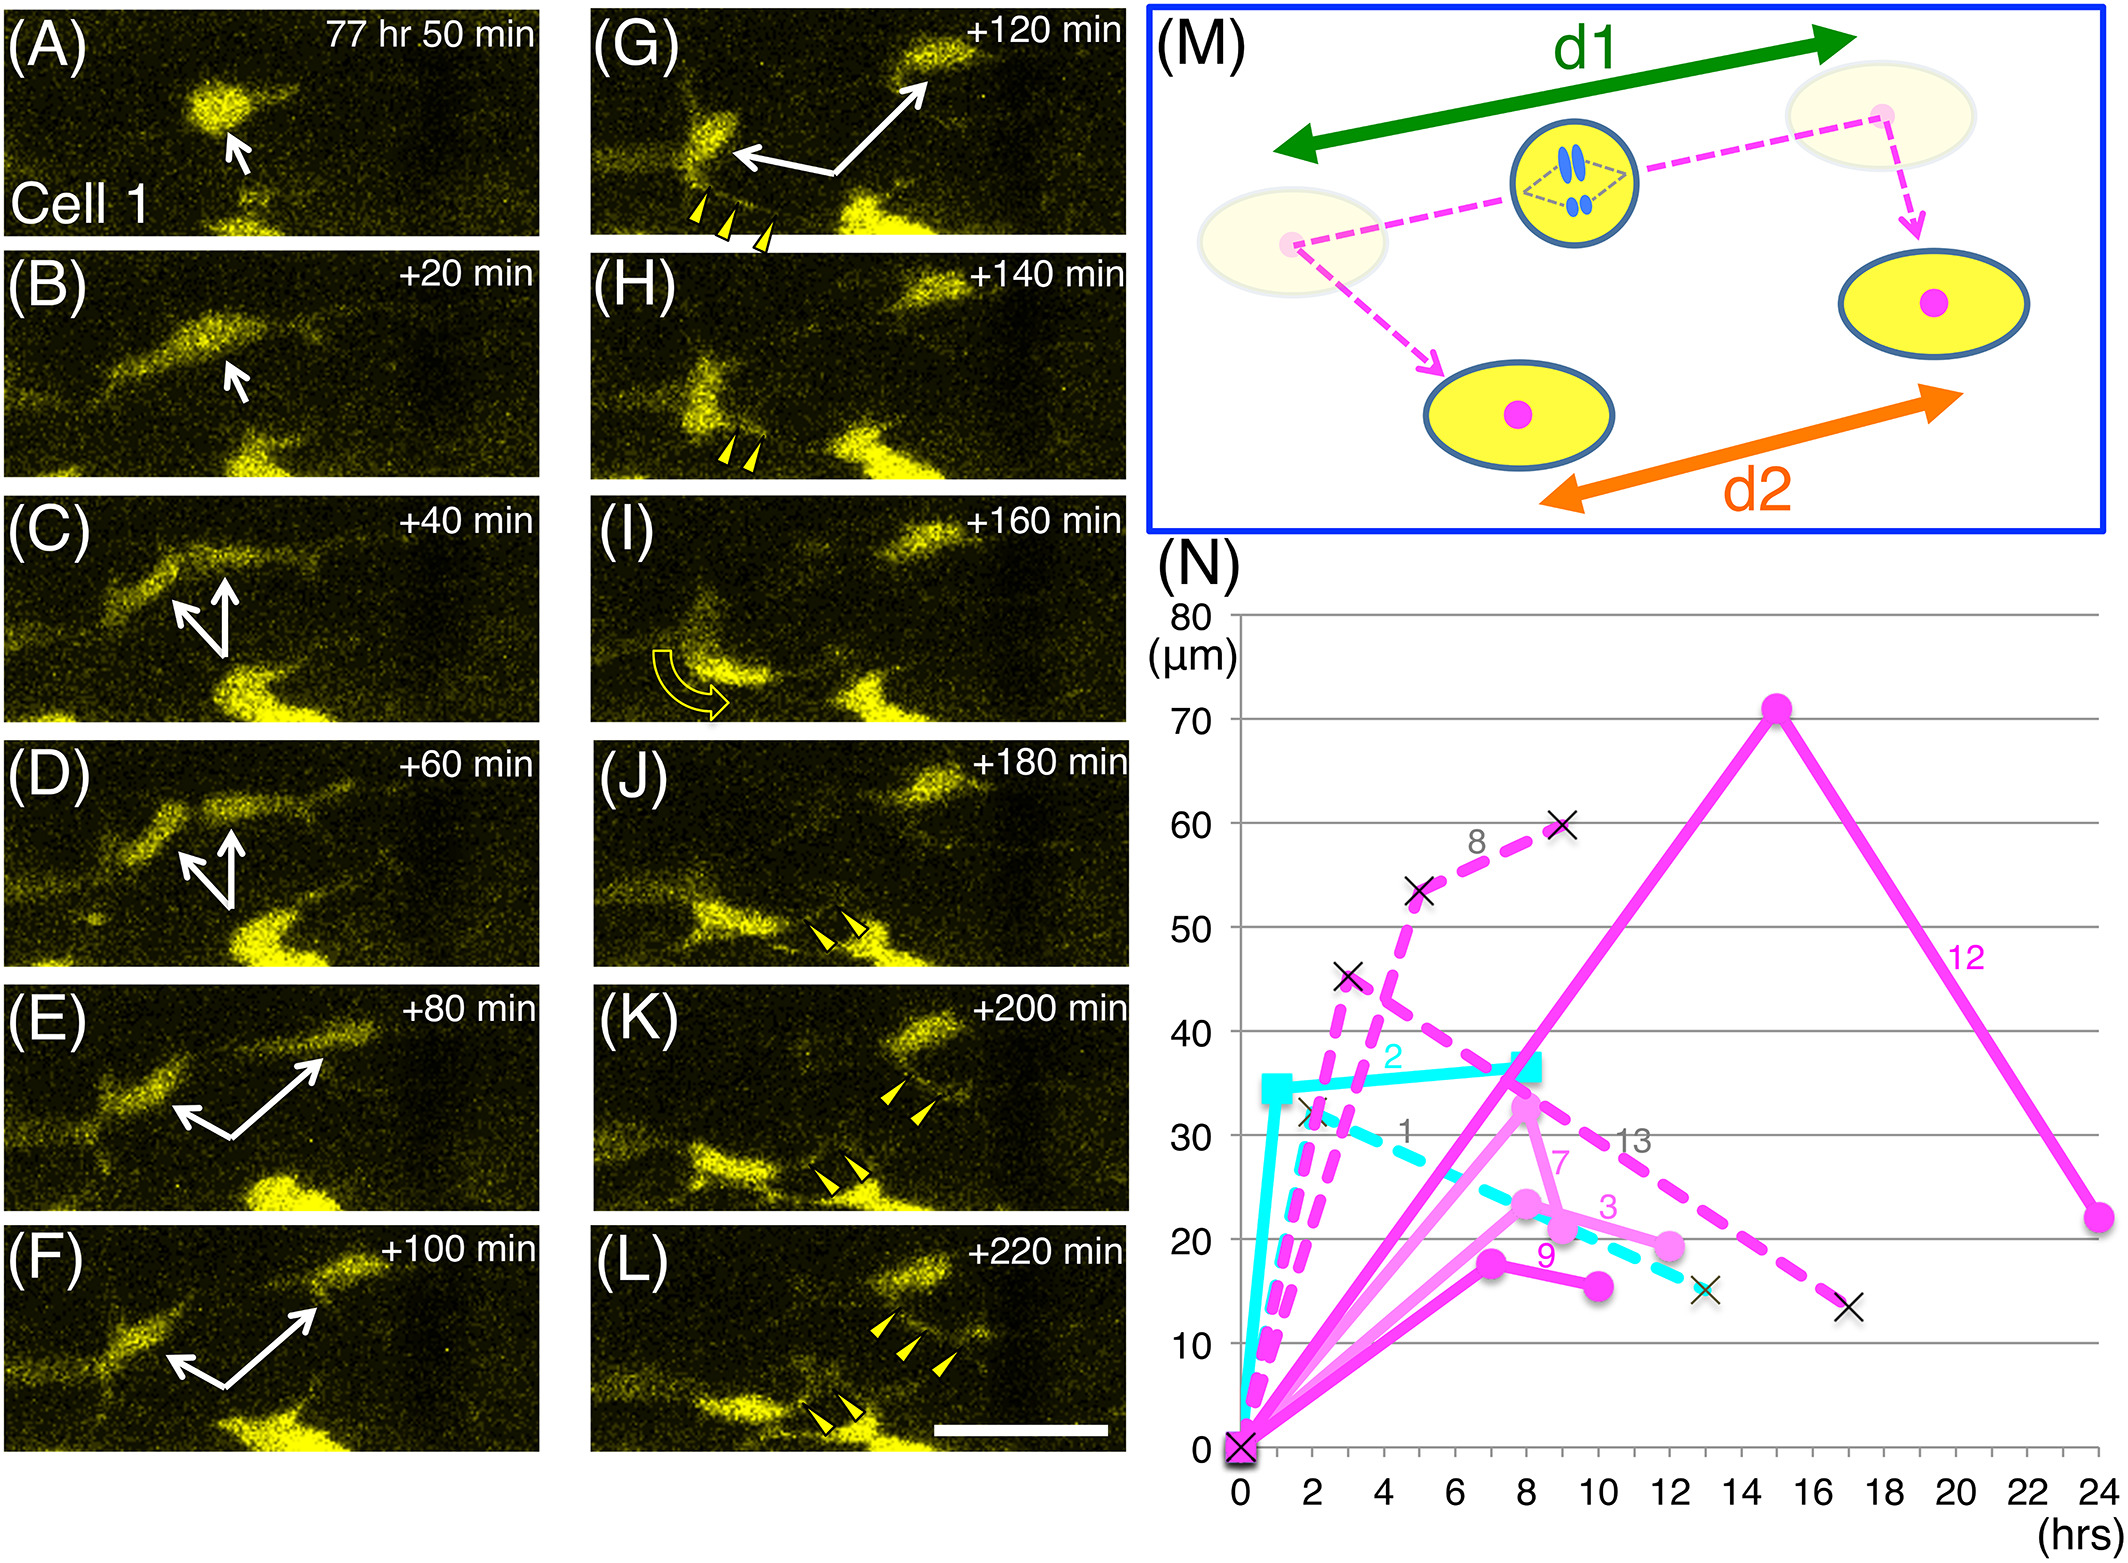
Behavior of daughter cells after ENCC division. Most of the sibling cells migrated apart at first, then later changed direction and came closer to each other. A‐L, Serial images of the division process of cell no. 1. Images were taken every 20 min, starting at 77 hr 50 min postfertilization as shown in the top‐right corners. White arrows in A‐G indicate cell no. 1 before (A,B) and after (C‐G) separation. The yellow triangles in G‐L mark cellular processes that extend from the daughter cells toward the direction of migration (the curved yellow arrow in I). Scale bar = 25 μm. M, A schematic drawing of the behavior of cell no. 1 daughter cells. Daughter cells first moved apart from each other, and thereafter often changed direction (dashed magenta arrow). We measured the distances in the movies just before these cells changed direction (d1) and at the end of the movies (d2). N, The distance between each pair of daughter cells (the same cells described in Figures 4-6; the cell no. is indicated with each graph) is shown in terms of time after division. Data plotted with circular markers with strong and weak magenta lines are for cells that produced only strongly and weakly Hu + neurons respectively, and the data plotted with rectangular markers with cyan lines are for cells that produced Sox10+ cells. Data plotted with crosses and dashed lines are for cases in which one of the daughter cells was Hu‐/Sox10‐ (see Figure 5)

