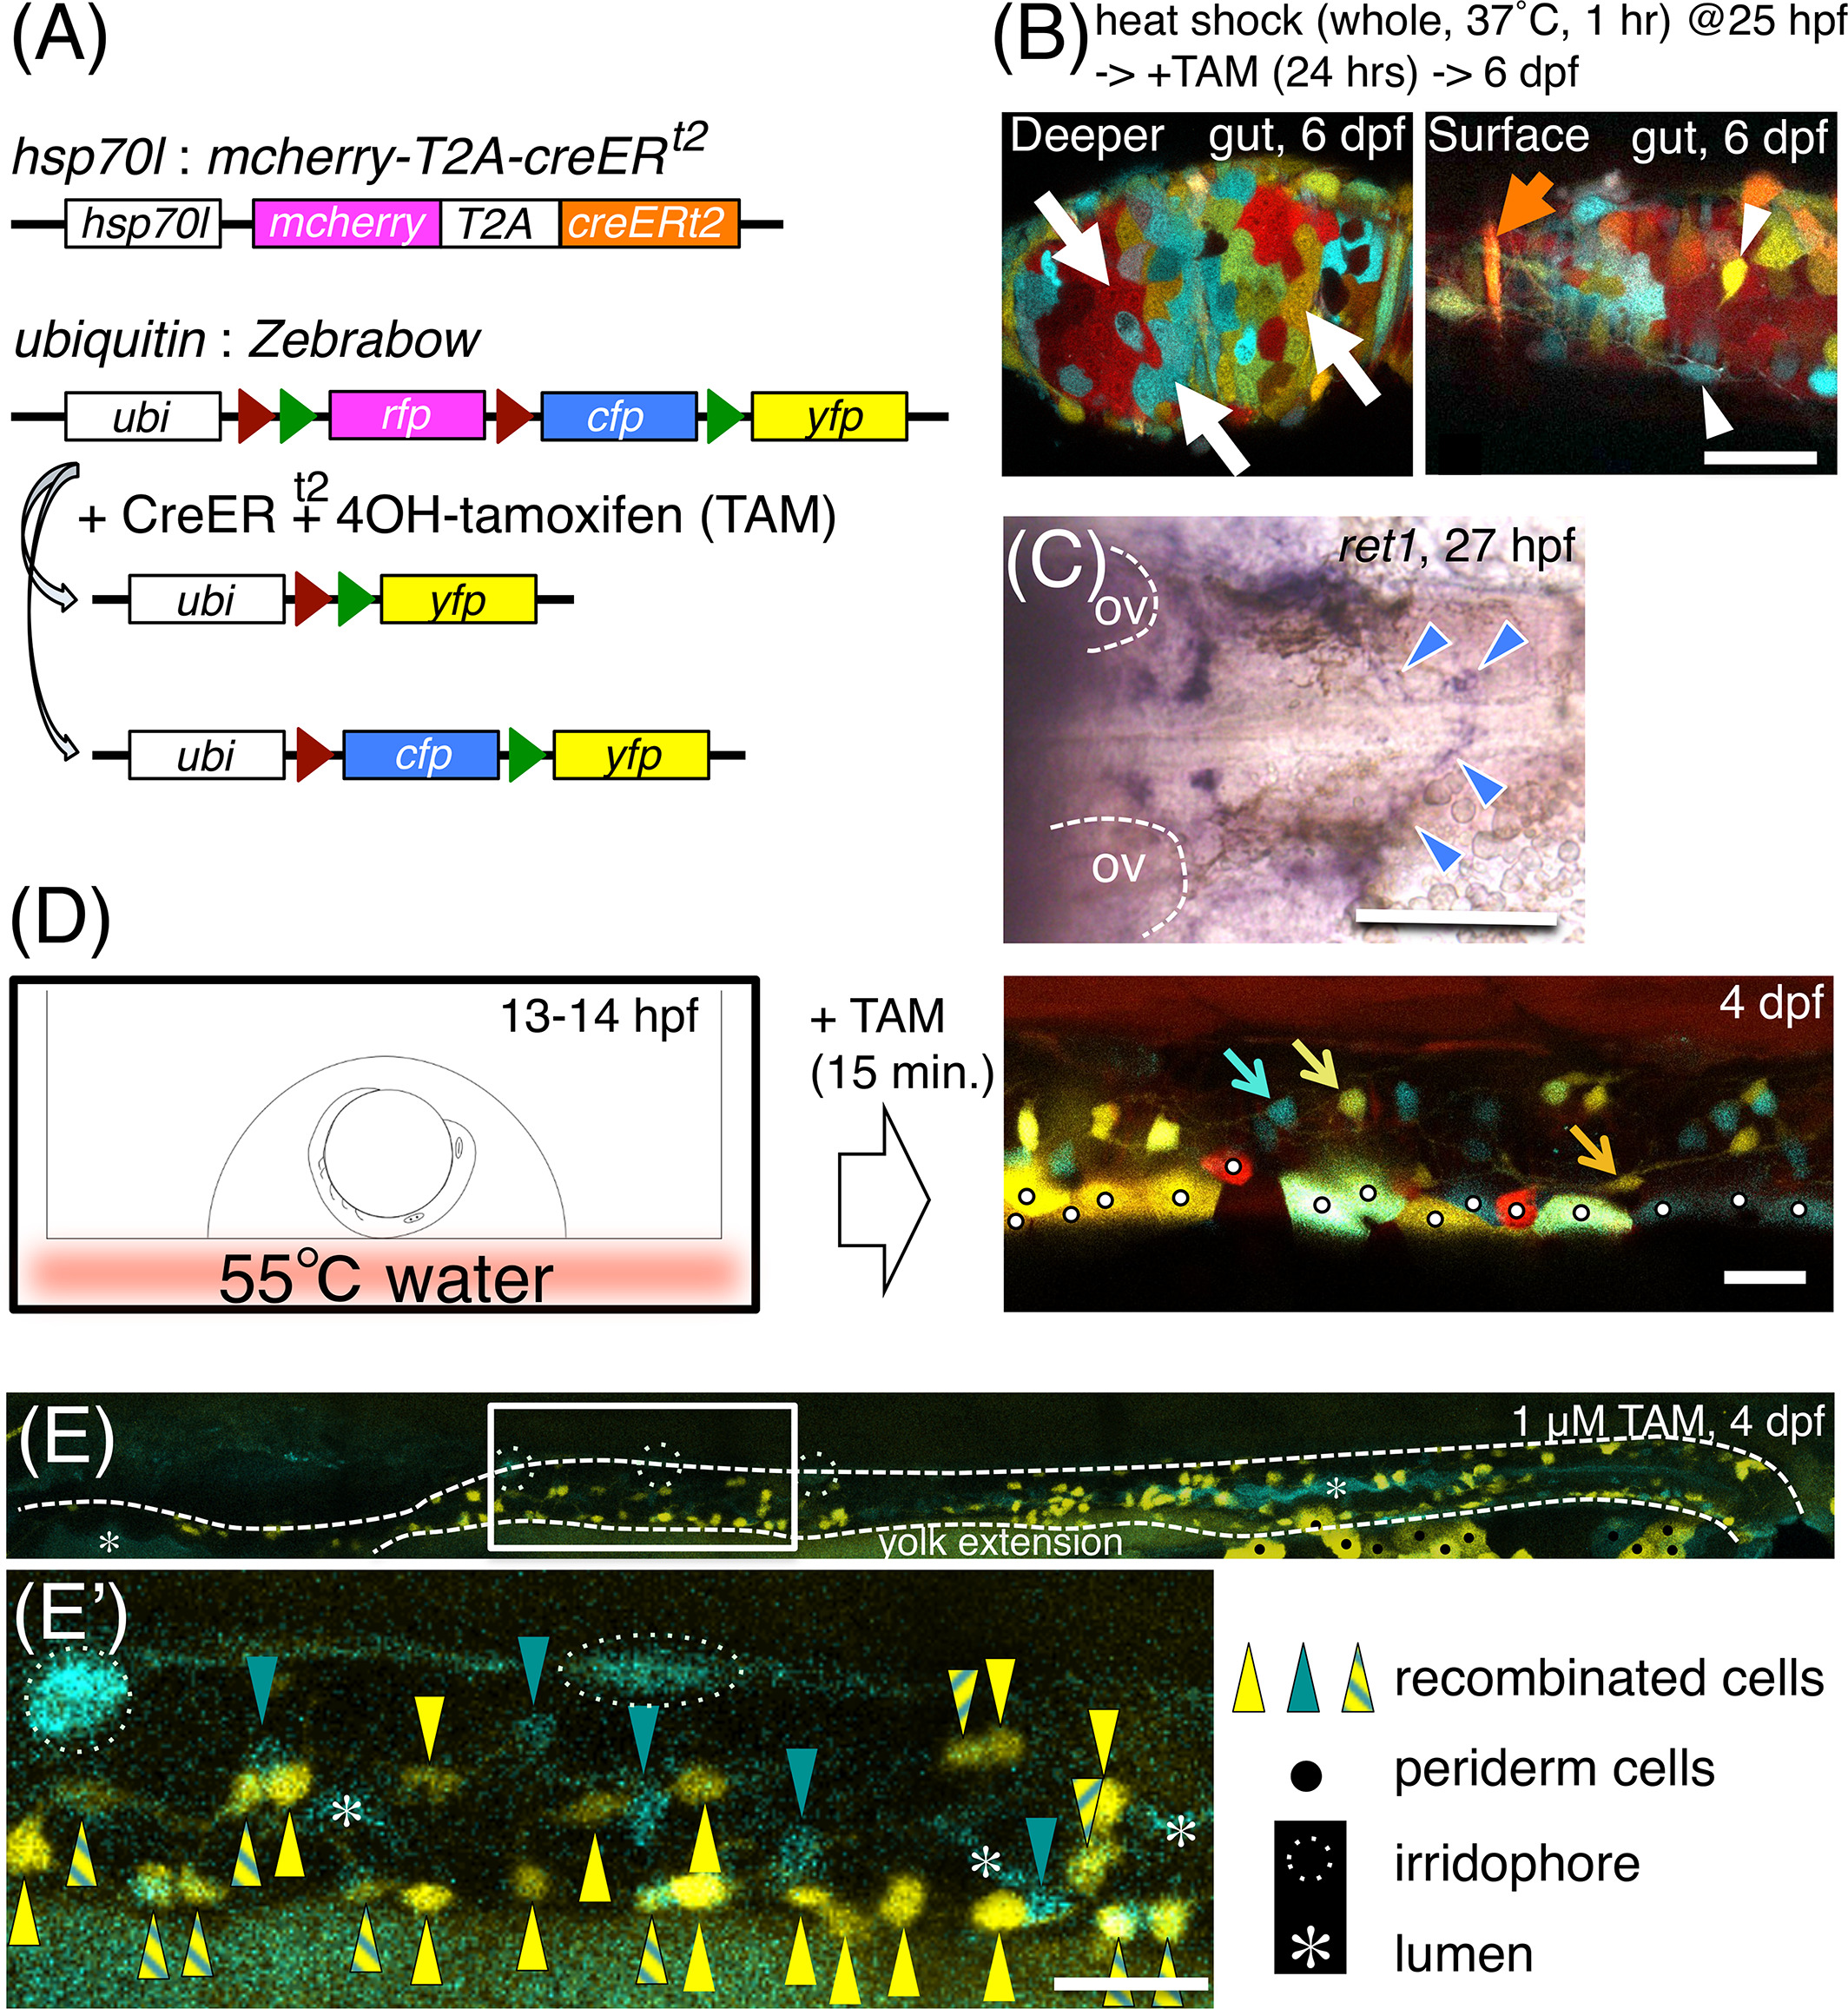
Fig. 1
Local heat‐shock‐induced multicolor labeling of enteric neurons. Heterozygotic crosses between Tg(hsp70l:mcherry‐T2A‐creER t2) and Tg(ubiquitin:Zebrabow) were used. A, Constructs introduced into the transgenic fish. B, Zebrabow‐derived hues mark the multiple tissue types of the gut dissected at 6 dpf, after heat shock to whole embryos as indicated. Left panel: mucosal level. Right panel: a level near the surface. White arrows: mucosal cells (red, RFP; yellow, YFP; cyan, CFP). Orange arrow: a putative circular muscle cell. White arrowheads: enteric neuron‐like cells. Scale bar = 20 μm. C, ENCCs at 27 hpf, migrating toward the midline of the pharyngeal region, marked by the in situ hybridization of ret1. Blue arrowheads: ret1+ ENCCs. Otic vesicles (OV) are outlined by dashed lines. Dorsal view. Anterior, to the left. Scale bar = 100 μm. D, Application of local heat shock to the dorsal vagal area by floating an embryo on hot water (55 °C) for 3 sec. Enteric neurons (marked by arrows in blue, yellow, or orange) were detected in the gut at 4 dpf. White dots: accidentally marked periderm cells. Lateral view of the distal intestine. Anterior, to the left. Dorsal, to the top. Scale bar = 25 μm. E,E′, YFP+ cells and CFP+ cells are mixed with each other in the gut at 4 dpf. E′, An expanded image of E. White dashed lines: guts. Yellow triangles: YFP+ cells. Turquoise triangles: CFP+ cells. Yellow triangles with turquoise stripes: YFP+/CFP+ cells. Black dots: periderm cells. White dotted lines encircle iridophores. White asterisks: intestinal lumen. Lateral view of the gut. Anterior, to the left. Scale bar = 25 μm in E′

