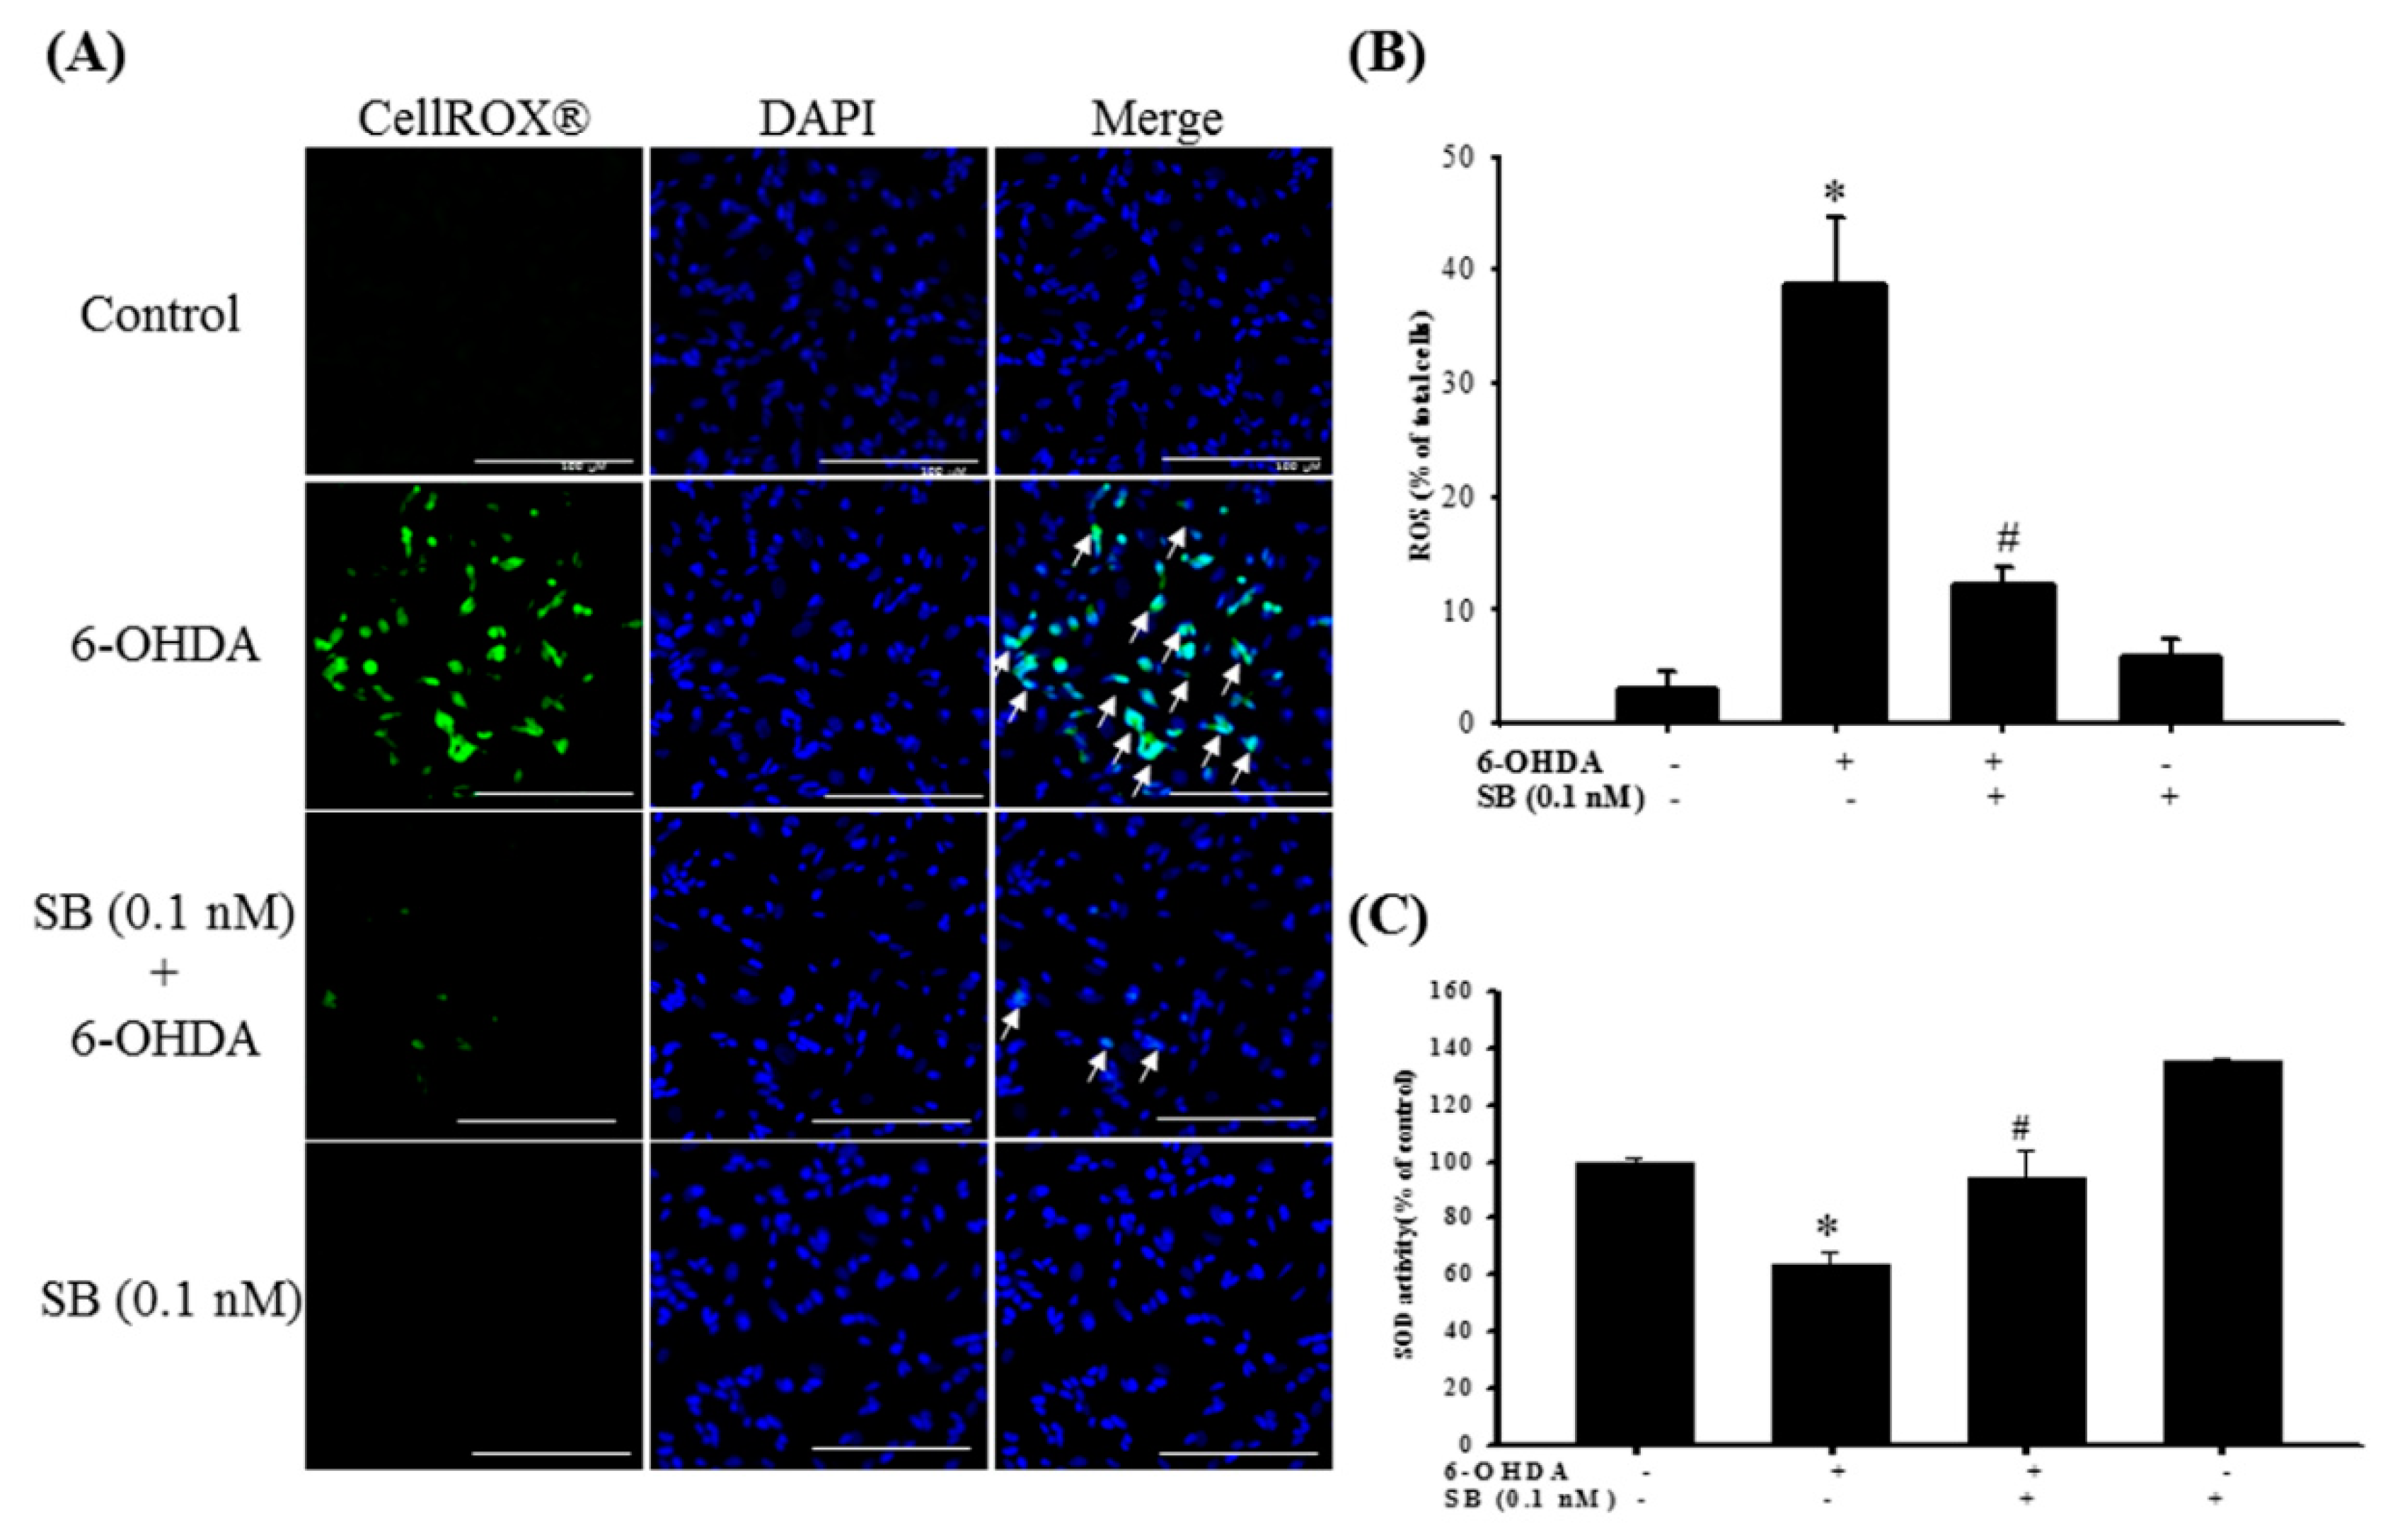
Fig. 5
Effect of SB on 6-OHDA-induced upregulation of intracellular reactive oxygen species (ROS) and downregulation of superoxide dismutase (SOD) activity. SH-SY5Y cells were pretreated with 0.1 nM SB for 1 h and then challenged with 20 μM 6-OHDA for 2 h. (A) CellROX® of the control, 6-OHDA, 6-OHDA plus SB, and SB treatment groups. White arrows indicate the location of ROS-positive cells (scale bar = 100 μM). (B) Quantification of the frequency of ROS-positive cells in each group. (C) SOD levels of the control, 6-OHDA, 6-OHDA plus SB, and SB alone treatment groups. Data are presented as mean ± SEM, and each value represents the mean of three replicates and three samples. *significant compared with the control group; # significant compared with the 6-OHDA group.

