Image
Figure Caption
Fig. S2
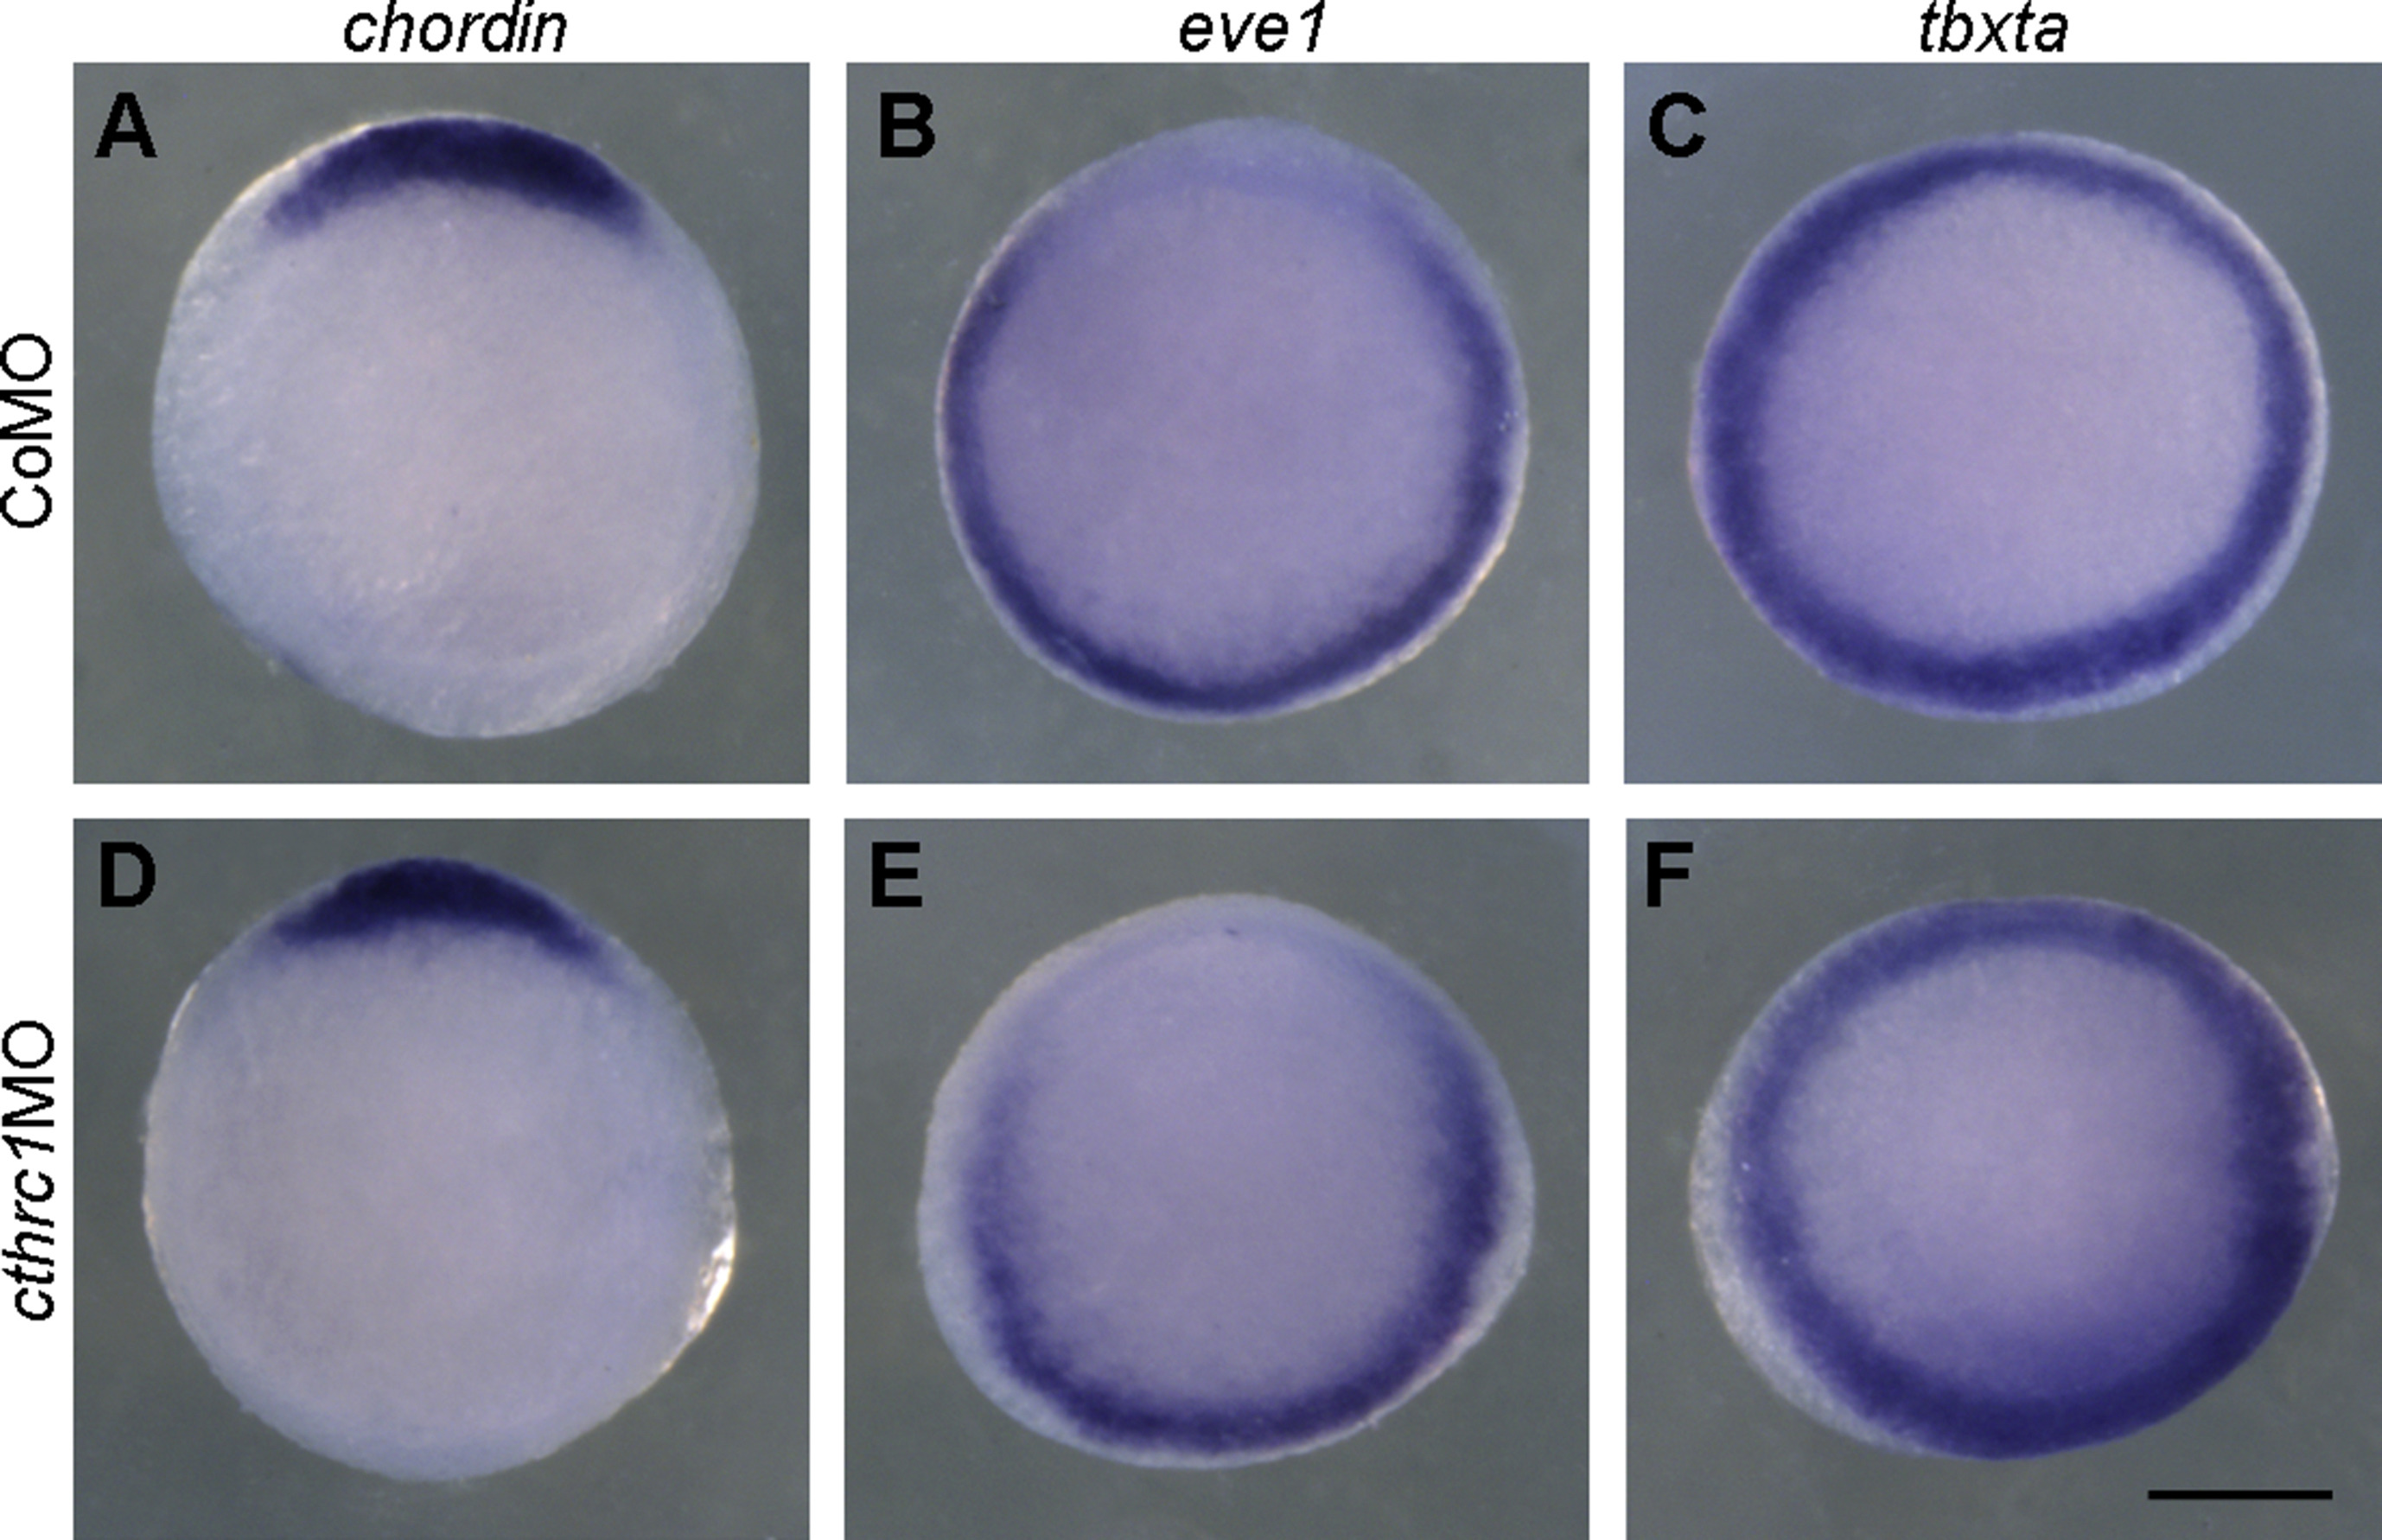
Expression of dorsoventral markers at shield stage following cthrc1aknockdown. Dorsal (chordin), ventral (eve1), and pan-mesoderm (tbxta) markers are indicated on the top. (A-C) CoMO-injected embryos. (D-F) Translation-inhibiting cthrc1MO-injected embryos. Animal pole view, with dorsal region on the top. Scale bar: 200?μm.2
Acknowledgments
This image is the copyrighted work of the attributed author or publisher, and
ZFIN has permission only to display this image to its users.
Additional permissions should be obtained from the applicable author or publisher of the image.
Full text @ Exp. Cell Res.

