
|
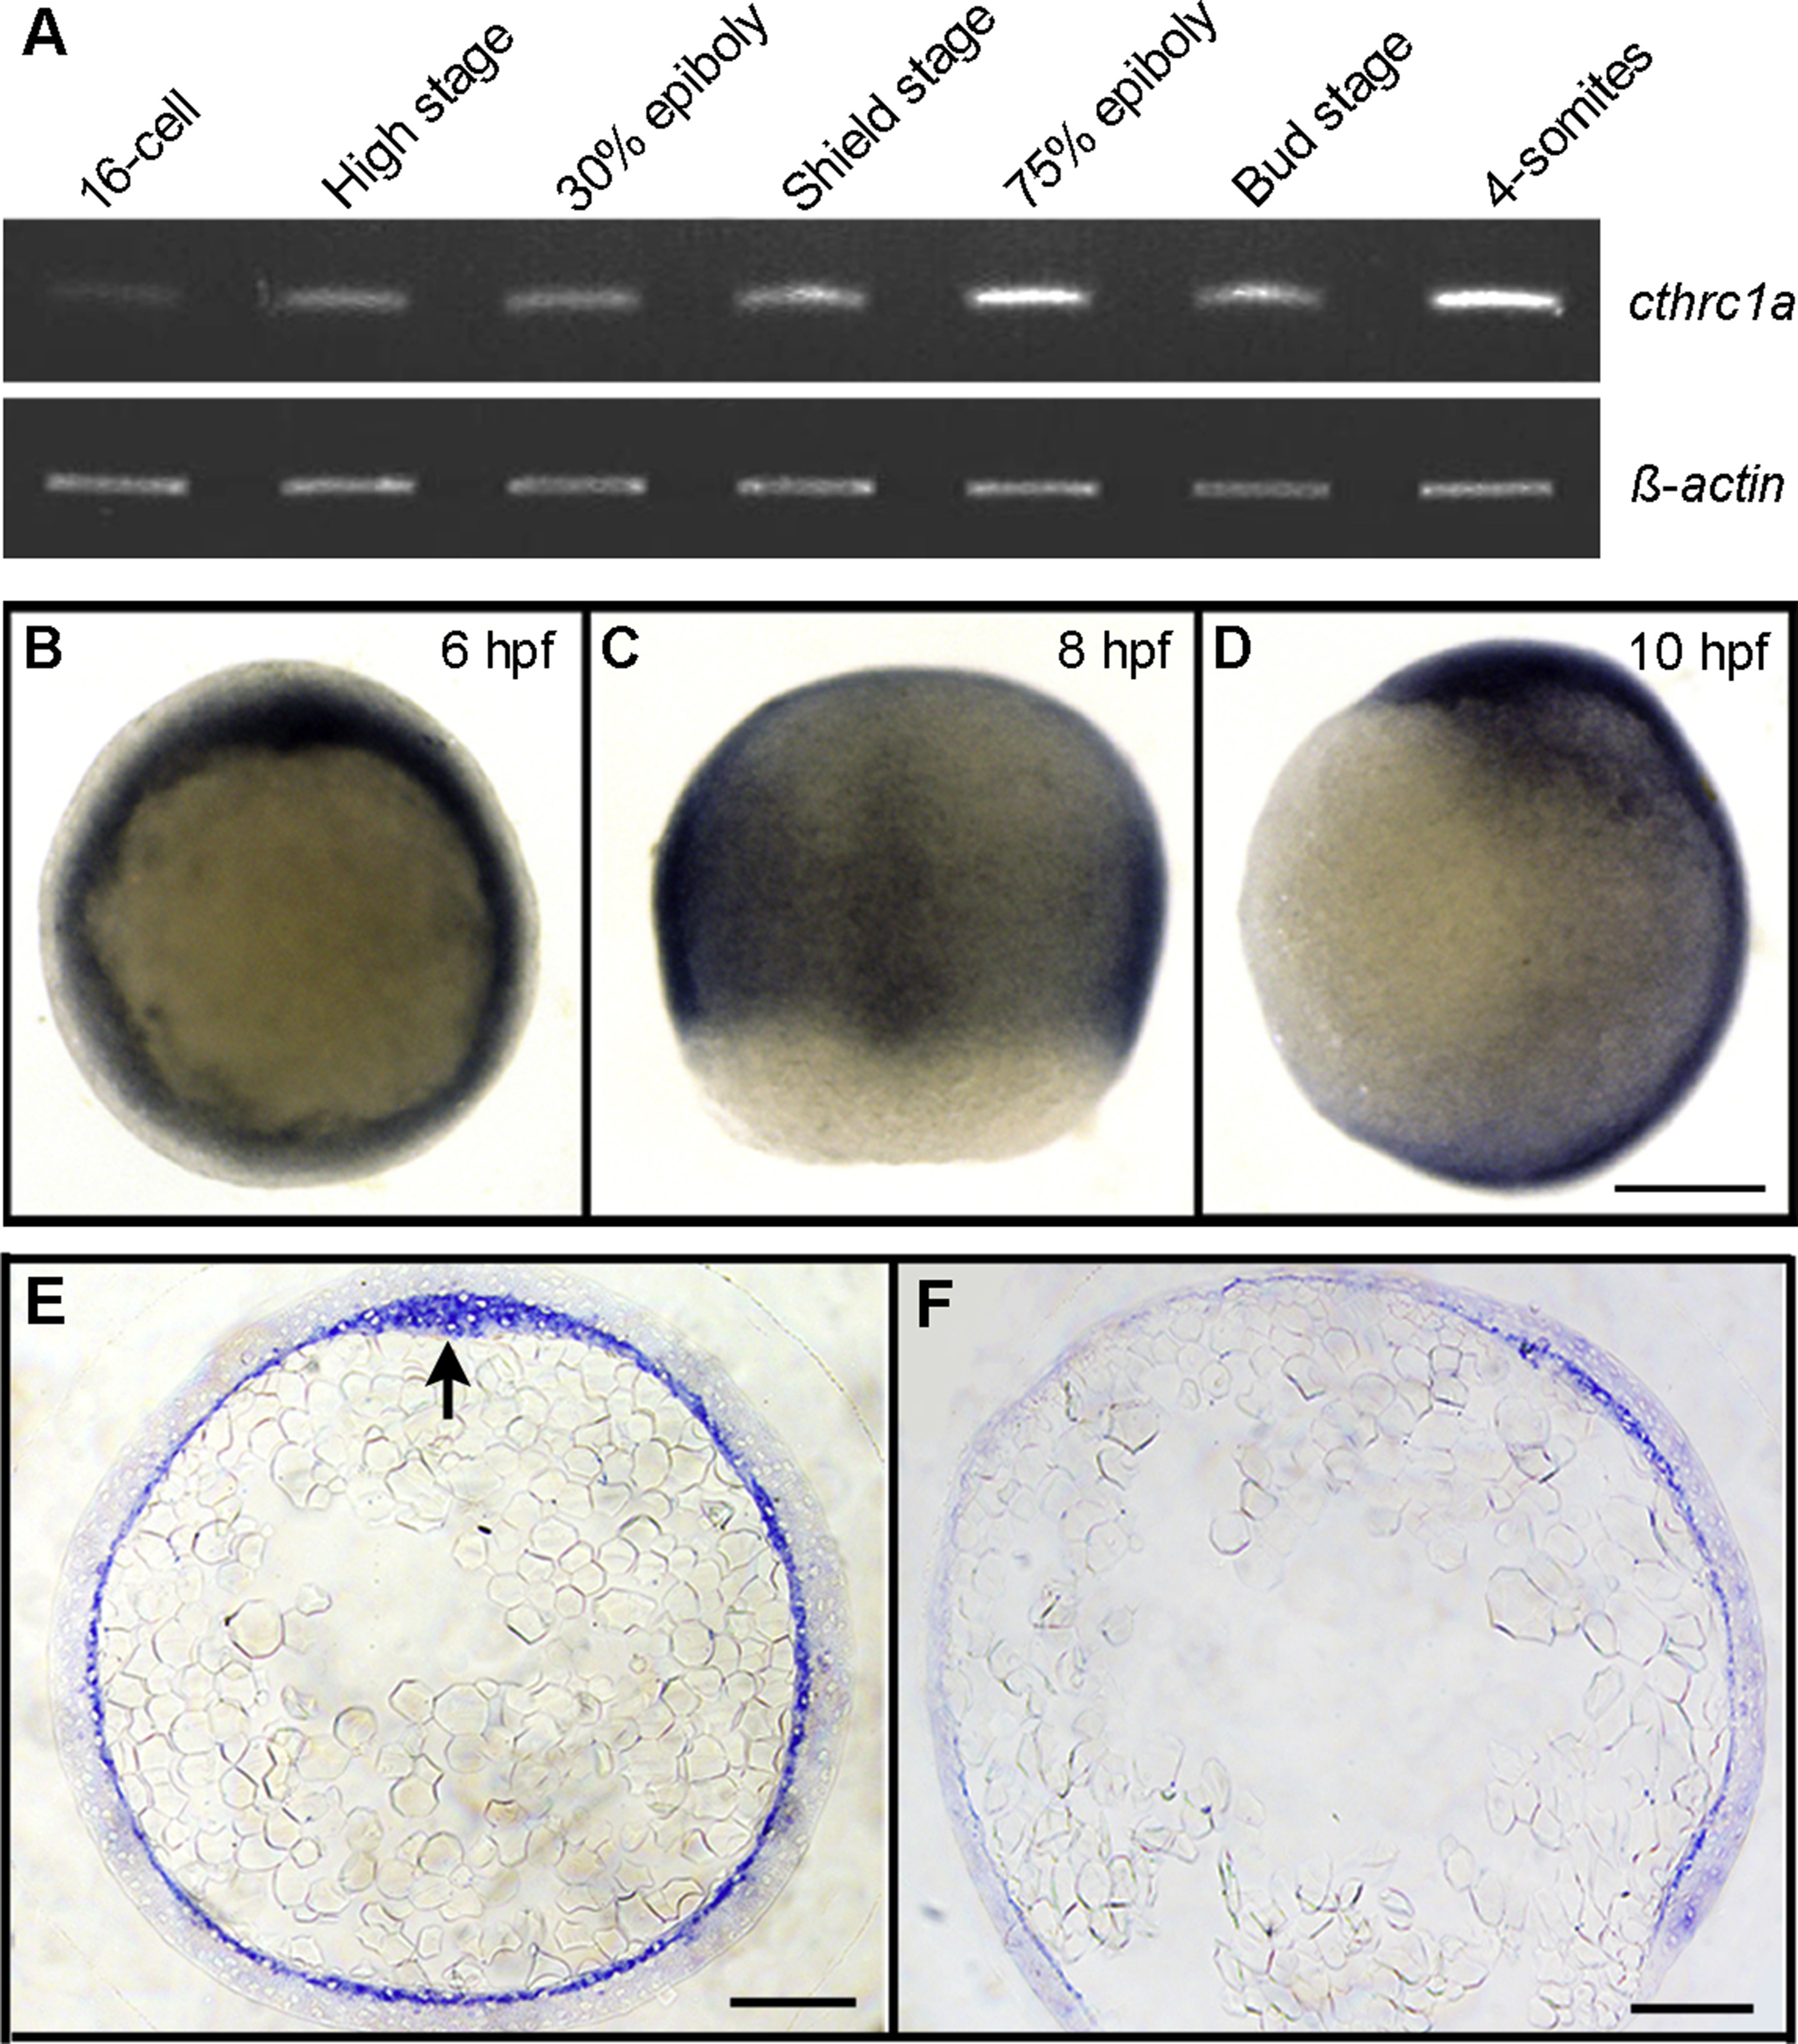
Fig. S1
Temporal and spatial expression patterns of cthrc1a during early development. (A) RT-PCR analysis of cthrc1a temporal expression at indicated stages. ß-actin was used as loading control. (B) At 6 hpf, cthrc1a transcripts are localised at the entire margin. Animal pole view. (C) At 8 hpf, dorsal view shows cthrc1a expression in the dorsal midline and lateral regions. (D) Lateral view of a gastrula at 10 hpf, cthrc1a expression is localised in the dorsal and lateral regions along the anteroposterior axis. (E) Cross section of a shield stage embryo through marginal zone. Dorsal midline is placed upwards, and arrow shows cthrc1a expression in the embryonic shield. (F) Sagittal section of an embryo at 80% epiboly showing enhanced staining in the dorsal yolk syncytial layer and the dorsal midline hypoblast cells. Animal pole region up and dorsal region on the right. Scale bars: 200?μm.