Fig. 1
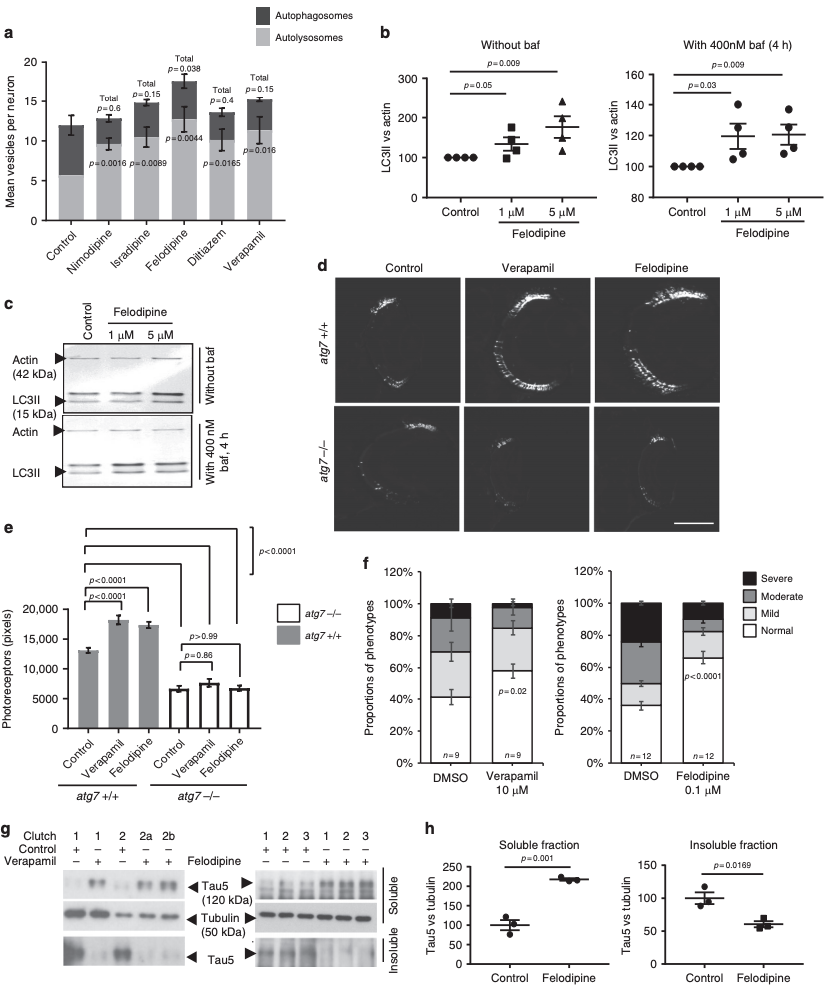
Screening of L-type calcium channel blockers in primary neurons and zebrafish. a Quantification of autophagosomes and autolysosomes in primary neurons from mRFP-GFP-LC3 mice treated with L-type calcium channel blockers (at 1 μM). Data represent mean number of vesicles/neuron +/− SEM, 4 independent experiments, two–tailed unpaired t-test. P values shown for autolysosomes and total vesicle number. b, c Wild-type primary neurons were treated with 1 and 5 μM felodipine for 5 h with and without 400 nM bafilomycin (last 4 h). Graph shows mean densitometry +/− SEM (LC3II vs. actin; n = 4 independent experiments; one-tailed, unpaired t-test). Data were normalised to the control (set to 100). c Representative western blots for LC3II in wild-type primary cortical neurons. d, e Verapamil and felodipine were tested in Rho::EGFP-Taucu7 fish—either in autophagy-null (atg7−/−) or wild-type-autophagy siblings (atg7+/+). d Representative fluorescence images of the GFP-positive rod photoreceptors in sections of Rho::EGFP-Taucu7 fish treated with DMSO, verapamil or felodipine, scale bar = 50 μm. e Quantification of rod photoreceptors from images of sections through the central retina after verapamil or felodipine treatment (n = 40 eyes/group); one-way ANOVA with post hoc Tukey’s multiple comparison test. Exact p values are provided for control (DMSO) compared to drugs for the same genotype. f Verapamil and felodipine ameliorated morphological defects in Dendra-tau-A152T fish (see Supplementary Fig. 2a for details of phenotype scoring). Data represent means +/− SEM; n ≥ 20 fish/ treatment group from ≥9 clutches. Two-tailed unpaired t-test. g Verapamil and felodipine increased the levels of sarkosyl-soluble tau and reduced the levels of insoluble tau in fractions from Dendra-tauA152T fish. h Graph shows densitometry of the mean ratios (±SEM) of soluble and insoluble tau vs. tubulin from fractions of 3 independent clutches (50 fish/group) normalised to mean DMSO value (set to 100); two-tailed unpaired t-test

