
Image
|
Figure Caption
Fig. S10
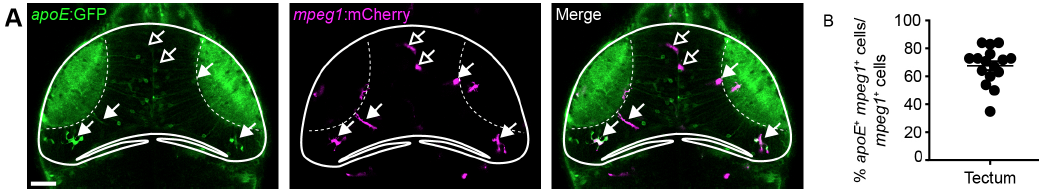
ApoE is expressed in a subset of mpeg1+ tectal cells. (A) Confocal images of the optic tectum of an apoE:GFP;mpeg1:mCherry animal. Filled or empty arrows indicate colocalisation, or lack thereof, between apoE and mpeg1. Scale bar, 50 μm. (B) Quantification of the proportion of apoE+/mpeg1+ cells among all mpeg1+ cells in the tectum. n = 16 animals
Acknowledgments
This image is the copyrighted work of the attributed author or publisher, and
ZFIN has permission only to display this image to its users.
Additional permissions should be obtained from the applicable author or publisher of the image.
Full text @ Development