
|
Fig. S3
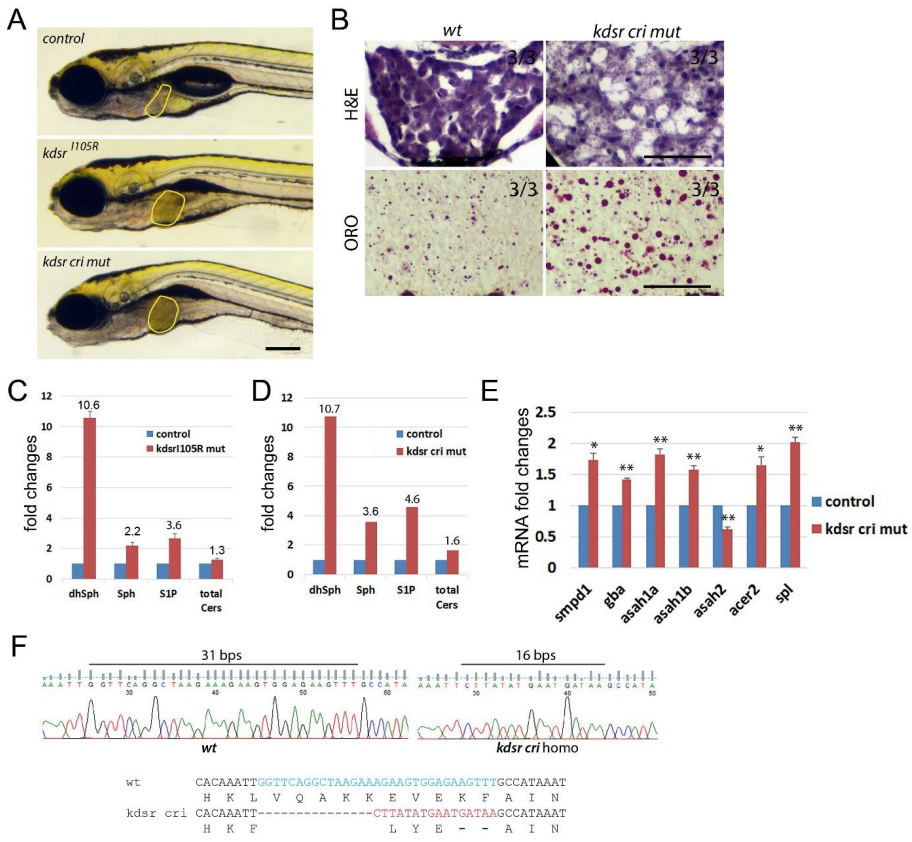
Supporting Fig. 3. The kdsrcri mutant generated by CRISPR gene targeting and sphingolipids profiling. Wild type and the kdsrcri mutant images at 7 dpf (A), Scale bar=0.25 mm. H & E staining and ORO staining in control (B, left), mutant at 7 dpf (B, right). Scale bar=50µm. Relative amount of sphingolipids from 30 control siblings and 30 kdsrI105R mutant larvae siblings at 7 dpf (C) and 30 control siblings and 30 kdsrcri mutant larvae siblings at 7 dpf (D). Relative mRNA expression in sphingolipid salvage pathway components in control siblings and kdsrcri mutants at 7 dpf (E). CRISPR/Cas9 RNA injection generated premature stop codon in exon3 of kdsr in the kdsrcri mutant by 31 bps deletion and 16 bps insertion (F). * P≤0.05, ** P≤0.005.