
|
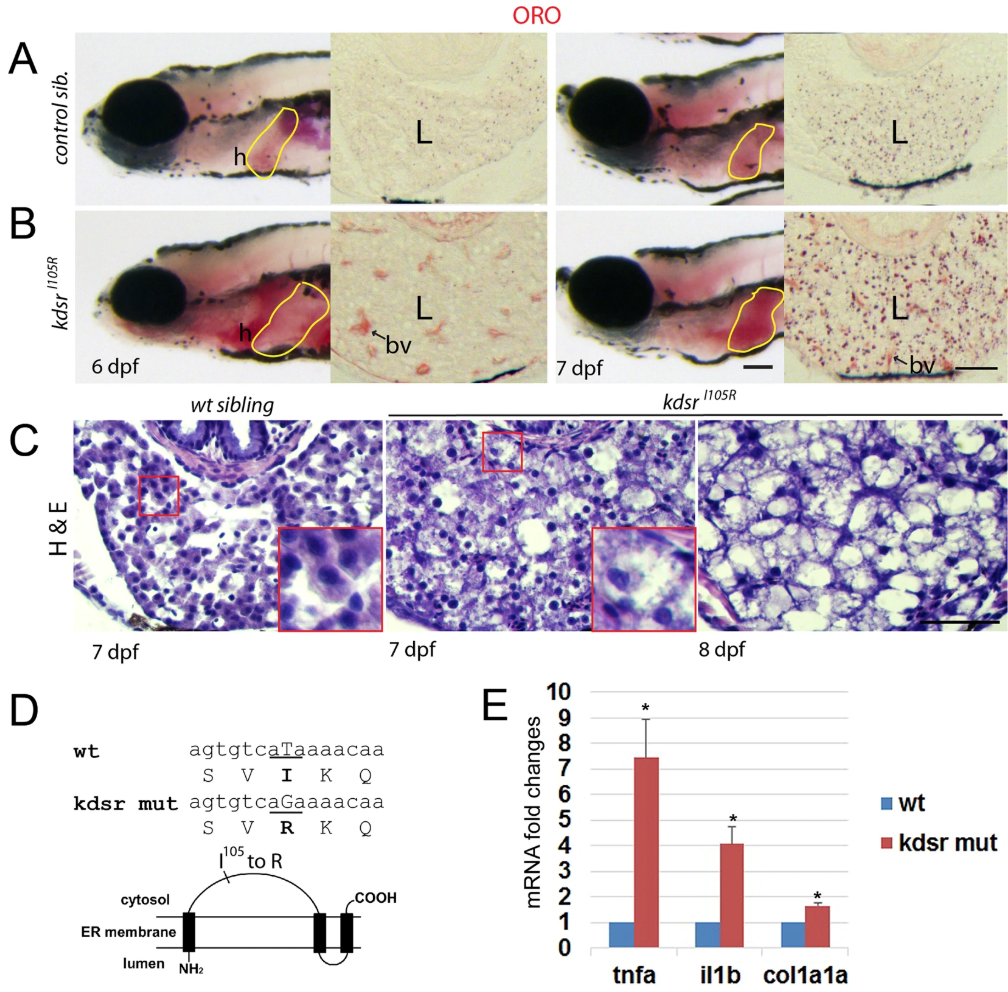
Fig. 1
Progression of liver injury in the KdsrI105R zebrafish mutant. Whole mount oil-red O (ORO) staining in wild type control sibling (A, left) and kdsr mutant (B, left) at 6 days post fertilization (dpf) and 7 dpf. ORO staining performed in transverse section of the liver (L, right panels of A and B). N = 10 per each. Lipid accumulation in the heart (h) and blood vessel (bv) are marked in images of panel B. H & E staining results in control at 7 dpf (left), mutant at 7 dpf (middle), and mutant at 8 dpf (right) (C, n = 6 per each). The magnified area depicts hepatocyte ballooning in mutants at 7 dpf. Images shown are representative of at least 10 other zebrafish or livers, respectively. Scale bars = 100 µm (whole mount ORO staining in A and B), 40 µm (ORO staining on the liver section in A and B), and 100 µm (H&E staining in C). The predicted protein structure of kdsr and the locus of the mutated amino acid is shown in (D). Relative mRNA expression of tnfa, il1b, and col1a1a in the wild type and mutant siblings is shown in (E). *P ≤ 0.05.