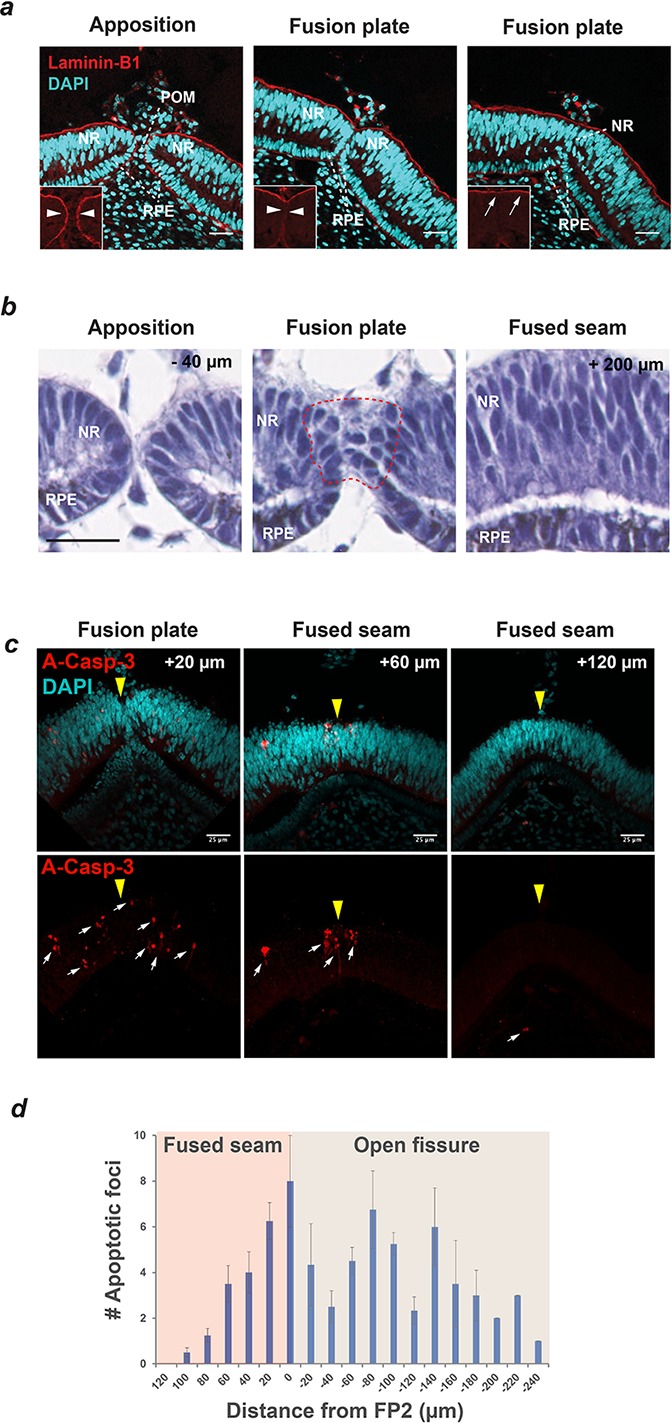
Figure 2 Basement membrane remodelling, loss of epithelial characteristics and apoptosis are defining features of Chick OFC. (a) Immunostaining for the basement membrane (BM) component Laminin-B1 and nuclear staining (DAPI) using confocal microscopy illustrated that fusion was preceded by the dissolution of BM (compare arrowheads in boxes) as the fissure margins came into contact at the fusion plate, and that fusion was characterised by the generation of a BM continuum at the basal aspect of the neural retina (arrows). Nuclear staining indicated that cells of the retinal pigmented epithelium (RPE) and neural retina (NR) contributed to the fusion plate and that periocular mesenchymal cells were removed from the region between the apposed margins. Images are from a single OFM and are representative of n ? 3 samples. (b) H and E staining on paraffin sections at FP2 showed apposed fissure margins with well organised epithelia in NR and RPE (?40 Ám from FP2); subsequent sections at the fusion plate showed loss of epithelial organisation in both cell types (within hatching); at the fused seam (+200 Ám from FP2) continuous organised layers were observed in both NR and RPE epithelia. Note that fusion occurred from contributions of both NR and RPE. (c) Immunostaining for the apoptosis marker activated Caspase-3 (A-Casp3) on serial cryo-sectioned OFMs (HH.St30) using confocal microscopy (z-stack projections) indicated that A-Casp3 positive foci (arrows) were enriched in epithelia at the OFM and in the nascently fused seam. The midline OFM, including the fusion points, is indicated by yellow arrowheads in all panels. OFMs were counterstained with DAPI. (d) Quantitation of A-Casp3 foci from serially-sectioned OFMs confirmed significant enrichment at FP2, with a graded reduction in apoptotic cells in both directions away from the fusion plate. Data shown are the mean of all measurements (n = 4); error bars = 95% Confidence intervals. Scale bars = 25 Ám in a and c, =20 Ám in b.
Image
Figure Caption
Acknowledgments
This image is the copyrighted work of the attributed author or publisher, and
ZFIN has permission only to display this image to its users.
Additional permissions should be obtained from the applicable author or publisher of the image.
Full text @ Elife

