
|
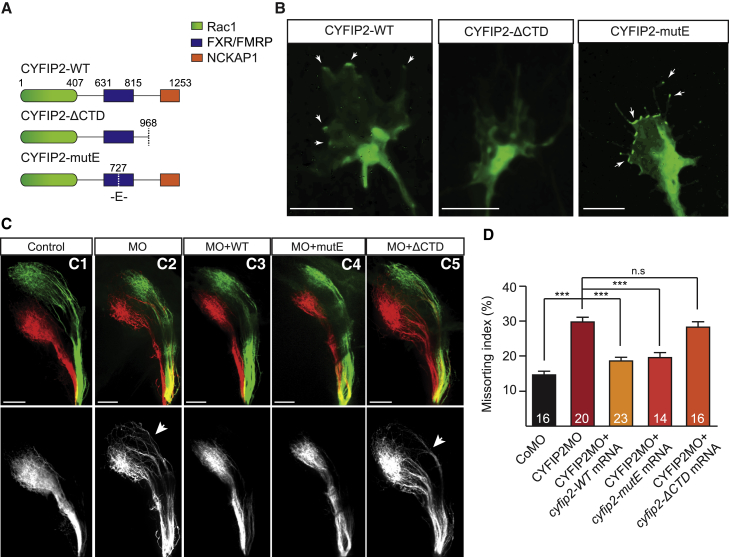
Figure 7
CYFIP2 Regulation of the WRC Mediates Axon Sorting in the Tract
(A) Schematic illustrating CYFIP2’s regulatory domains and mutations.
(B) Representative examples of CYFIP2WT-GFP (n = 9 GC), CYFIP2ΔCTD-GFP (n = 11 GC), and CYFIP2mutE-GFP (n = 13 GC) expression in Xenopus retinal cultures (n = 4 experiments). Arrows indicate CYFIP2-GFP accumulation in the growth coneperipheral domain and filopodia.
(C1–C5) Lateral-view of whole-mount 5 dpf zebrafish embryos injected with DiI and DiO in the dorsal and ventral retina, respectively. Co-injection of CYFIP2MO + CYFIP2WT (C3) or CYFIP2mutE (C4), but not CYFIP2ΔCTD (C5), mRNAs rescue the pre-sorting defect observed in CYFIP2MO-injected embryos (C2) compared to CoMO-injected embryos (C1).
(D) Quantification of the Missorting Index (Mann-Whitney test, ∗∗∗p < 0.001, n.s., non-significant).
Error bars represent SEM. The number of zebrafish analyzed is indicated on the bars. Scale bars: 5 μm (B) or 50 μm (C). See also Figures S3 and S4.
(E) Quantifications of D and V axonal projection area in the OT at 48 hpf.
(F) The missorting index (MI) was quantified as the ratio of the intensity signal of the missorted D (Dm) axons to all the D axons (Dm+Ds). For gRNA cyfip1-injected embryos, only the embryos showing an axon growth phenotype were quantified (n = 18 embryos).
Error bars represent SEM. ∗∗p < 0.01, ∗∗∗p < 0.001, n.s., non significant (Mann-Whitney test for E and F). The number of zebrafish analyzed is indicated on the bars. Scale bars: 50 μm (C1–D3). See also Figure S1.