
|
Figure 5
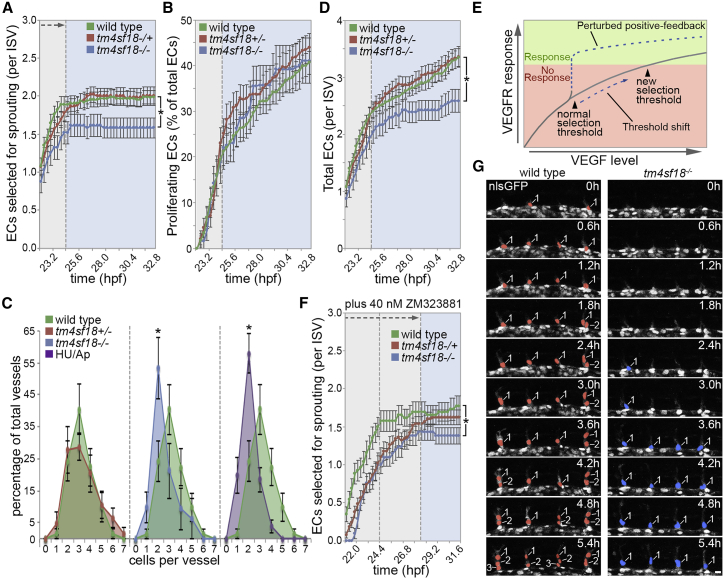
Tm4sf18 Modulates the Magnitude and Timing of the Angiogenic Response
(A and B) Quantification of the number of ECs selected to branch (A) or the percentage of ECs that undergo proliferation (B) in WT,
(C) Quantification of the distribution of ISV cellularity in WT,
(D) Quantification of the total number of ECs per ISV in WT,
(E) Predicted shift in the level of VEGF signaling required to achieve a selection threshold in the absence of positive feedback.
(F and G) Quantification of the number of ECs selected to branch in 40 nM ZM323881-treated WT,
Data are means ± SEM. ∗p < 0.05, two-way ANOVA or two-tailed t test. Scale bar, 25 μm.
See also