
|
Figure 4
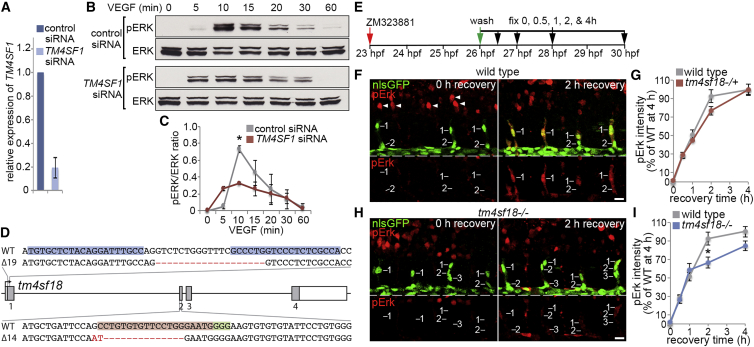
TM4SF1/Tm4sf18 Expression Feeds Back to Amplify VEGF/Vegf Signaling
(A) Relative expression levels of
(B and C) Western blot analysis of pERK/ERK levels in HUVECs after VEGF-A stimulation following transfection with control or
(D) Lesions introduced into the
(E) Strategy for assessing Vegfr signaling dynamics
(F–I) Lateral views of pErk immunostaining in ECs of WT (F) or
Data are mean ± SEM. ∗p < 0.05, two-tailed t test. Scale bars, 25 μm.