
|
Figure 3
Identification of Putative Positive-Feedback Modulators of Vegf Signaling
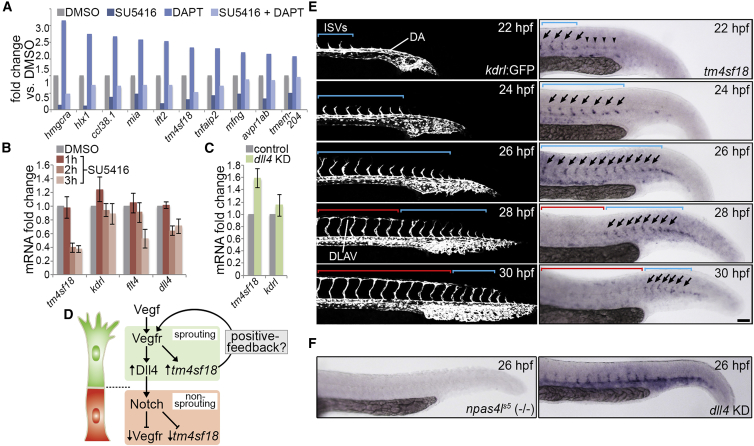
(A) Fold change in the indicated transcript levels by microarray following inhibition of Vegfr signaling (2.5 μM SU5416), Notch activity (100 μM DAPT), or both, from 22 to 30 hpf.
(B and C) Fold change in
(D) Illustration of the putative transcriptional regulation of
(E) Lateral views of sprouting ISVs in
(F) Whole-mount
Data are mean ± SEM. Scale bar, 100 μm.
See also