IMAGE

Fig. 7.

ID
ZDB-IMAGE-190723-2570
Genes
Antibodies
Source
Figures for Skvarca et al., 2019
Image
Figure Caption

Fig. 7.

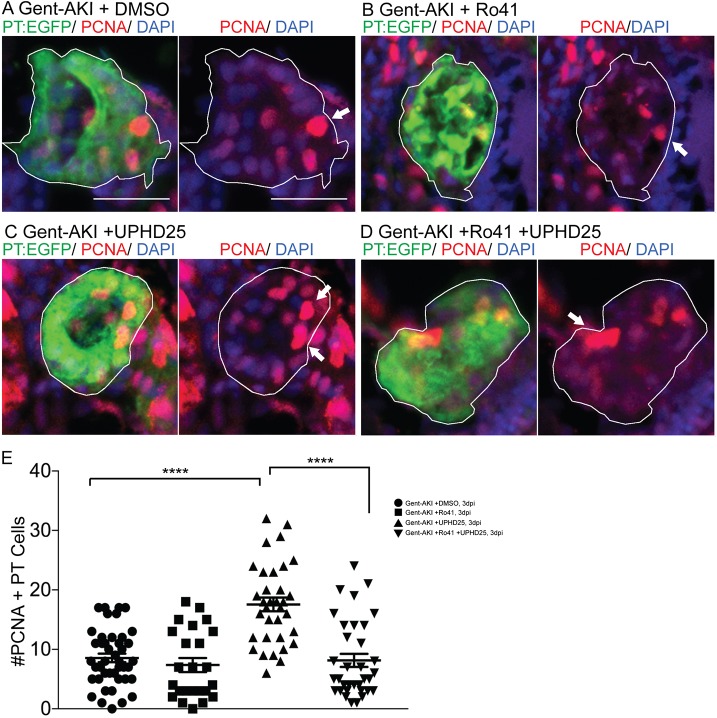
UPHD25 treatment efficacy requires intact RA signaling.Tg(PT:EGFP) transgenic zebrafish were used to analyze RTEC proliferation. (A-D) Immunofluorescence stain showing cells actively undergoing S-phase marked with PCNA antibody (red) and PT (green) in gent-AKI+DMSO (A), gent-AKI+Ro41 (B), gent-AKI+UPHD25 (C) and gent-AKI+Ro41+UPHD25 (D). PTs are outlined in white and arrows mark PCNA+ RTECs. (E) Quantification of PCNA+ RTECs in each treatment group. MeanUPHD25=17.56 (N=34) vs MeanRo41+UPHD25=8.15 (N=34). Data pooled from three biological replicates are shown expressed as mean±s.e.m. One-way ANOVA: ****P<0.001. Scale bars: 20 μm.

Figure Data
Acknowledgments
This image is the copyrighted work of the attributed author or publisher, and ZFIN has permission only to display this image to its users. Additional permissions should be obtained from the applicable author or publisher of the image. Full text @ Dis. Model. Mech.