IMAGE

Fig 2

ID
ZDB-IMAGE-190723-1605
Genes
Source
Figures for Oppel et al., 2019
Image
Figure Caption

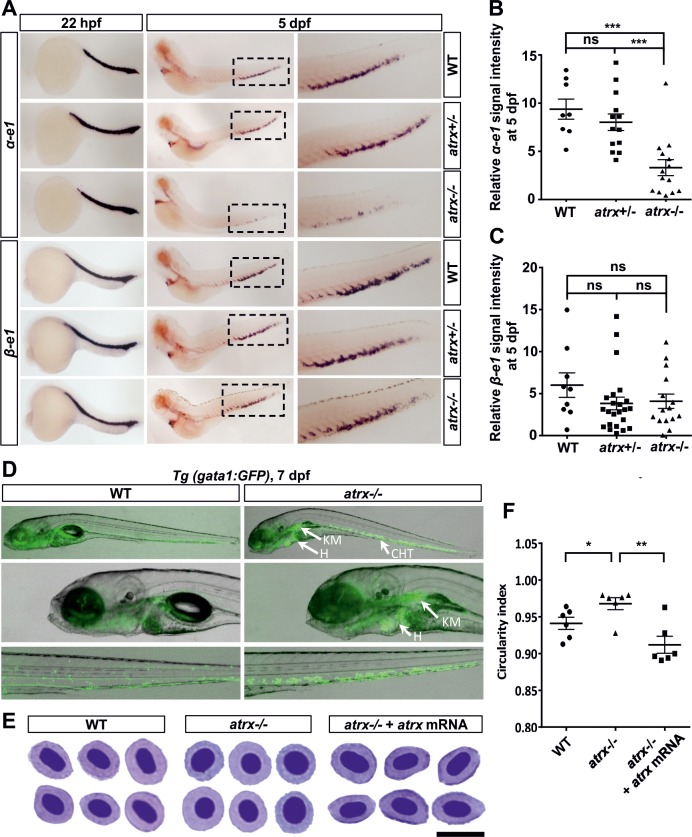
Fig 2 Homozygous loss of <italic>atrx</italic> results in an α-thalassemia-like phenotype in zebrafish development.

(A) Whole-mount in situ hybridization for α-e1 and β-e1 globins in wildtype (WT), atrx+/- heterozygous fish and atrx-/- homozygous mutants at 22 hpf and 5 dpf as indicated. Boxes outline the CHT region at 5 dpf, and are magnified in the right panels. Globin signal intensities of α-e1(B) and β-e1(C) in fish with different atrx backgrounds were calculated at 5dpf. Horizontal bars indicate the means ± SEM, which were compared with the two-tailed unpaired t-test; ns = not significant; ***p<0.001. (D) Erythroid progenitors development visualized by GFP in the Tg(gata1:GFP) transgenic line with wildtype (WT) or atrx-/- background at 7 dpf. CHT = caudal hematopoietic tissue; H = heart; KM = kidney marrow; dpf = days post fertilization. (E) Analysis of peripheral blood smears by MGG staining in wildtype fish (WT), atrx-/- homozygous mutant and atrx-/- homozygous mutant injected with zebrafish atrx mRNA at 7 dpf; scale bar: 10 μm. (F) Circularity index for the erythroid cells from fish with different atrx backgrounds (E) was calculated by ImageJ. Horizontal bars indicate the means ± SEM, which were compared with the two-tailed unpaired t-test; *p<0.05; **p<0.01.

Figure Data
Acknowledgments
This image is the copyrighted work of the attributed author or publisher, and ZFIN has permission only to display this image to its users. Additional permissions should be obtained from the applicable author or publisher of the image. Full text @ PLoS Genet.