
|
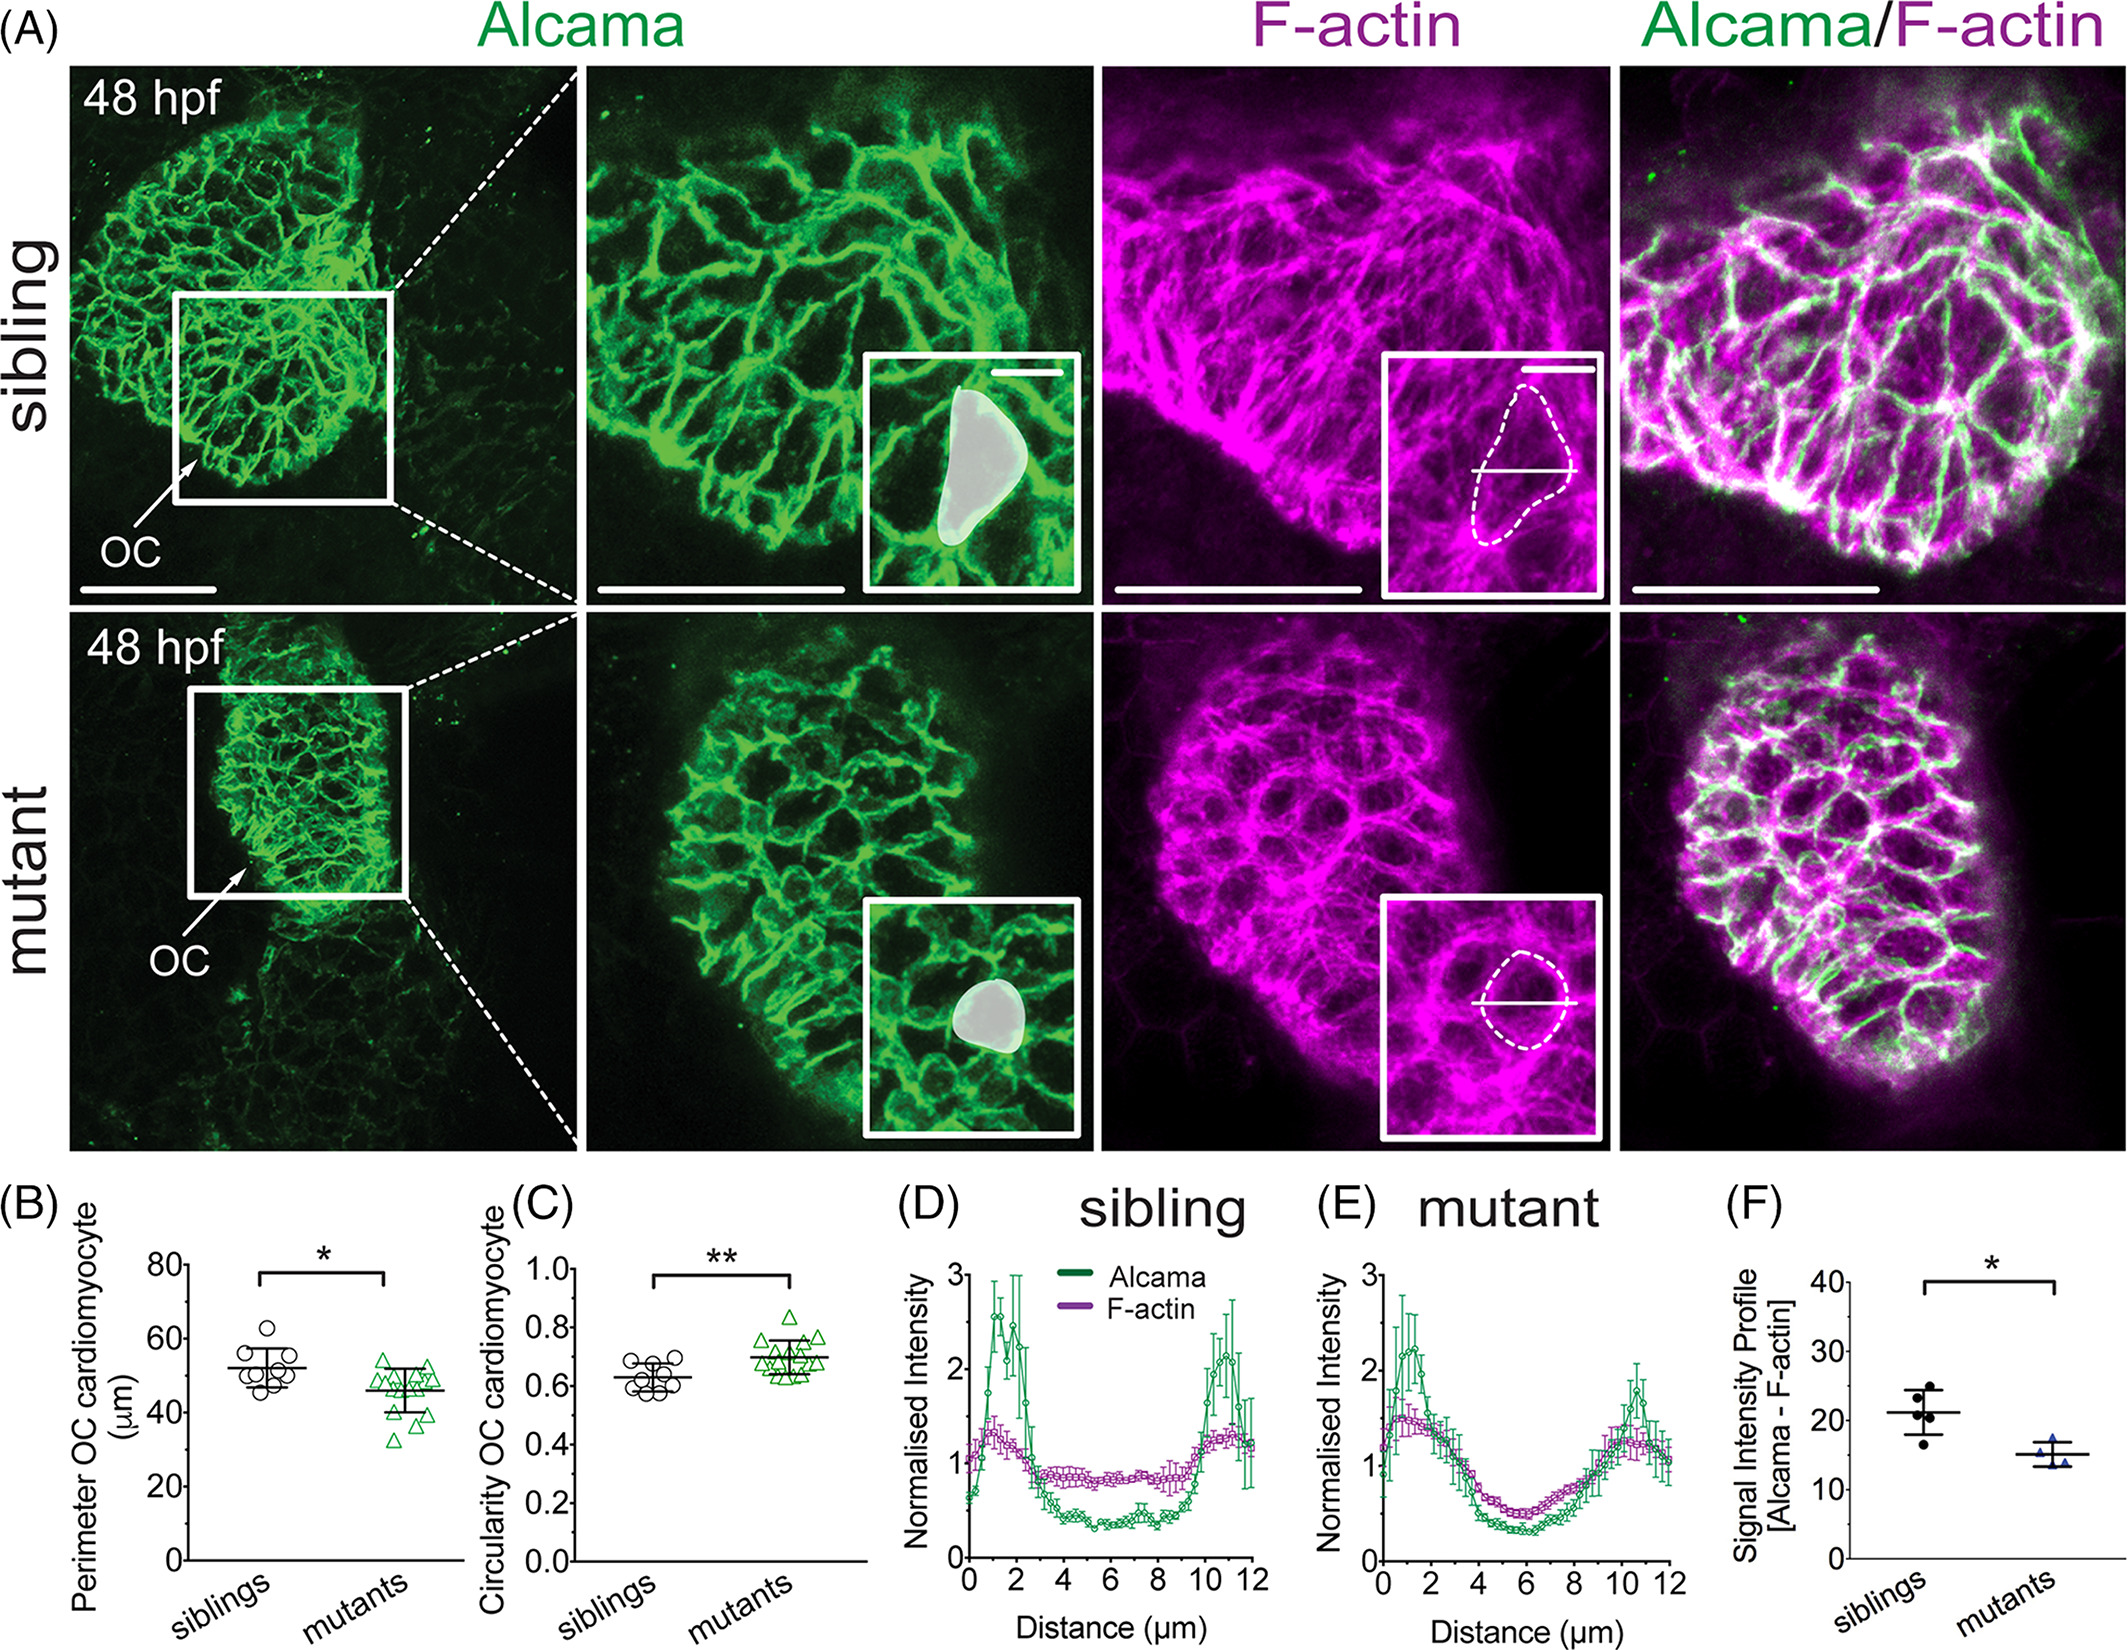
Fig. 6
Cardiomyocytes fail to elongate, displaying mispatterned F?actin in uq 23ksmutants. A:Confocal images of 48 hpf hearts immunostained for Alcama and stained with phalloidin to label F?actin. Cardiomyocytes in mutant hearts remain small and round, as represented by the white shading in boxed zoom, whereas sibling OC cells elongate. F?actin appears mislocalized in mutant cells, where it remains cortical, compared with wild?type cells, where it traverses the cells. Alcama staining demarcating cell outlines was used to measure perimeter (B) and circularity (C) of OC cardiomyocytes. B: Dot plot of OC cardiomyocyte perimeter, showing a decrease in uq 23ksmutants compared with siblings C: Dot plots showing uq23ks mutant OC cardiomyocytes have increased circularity. D,E:Graphs comparing the profiles of the normalized signal intensity of phalloidin and Alcama staining in cardiomyocytes of sibling and mutant embryos at 48 hpf. Fluorescence intensities were measured at the short axis of a given cell (shown in F?actin stained boxed zoom). F:Dot plot quantifying the difference between Alcama and phalloidin fluorescence profiles in wild?type vs. mutant cardiomyocytes. Mean ± SEM. *P < 0.05, **P < 0.01. Scale bars = 50 μm in D; 20 μm in boxed zooms. OC, outer curvature.