Fig. 4
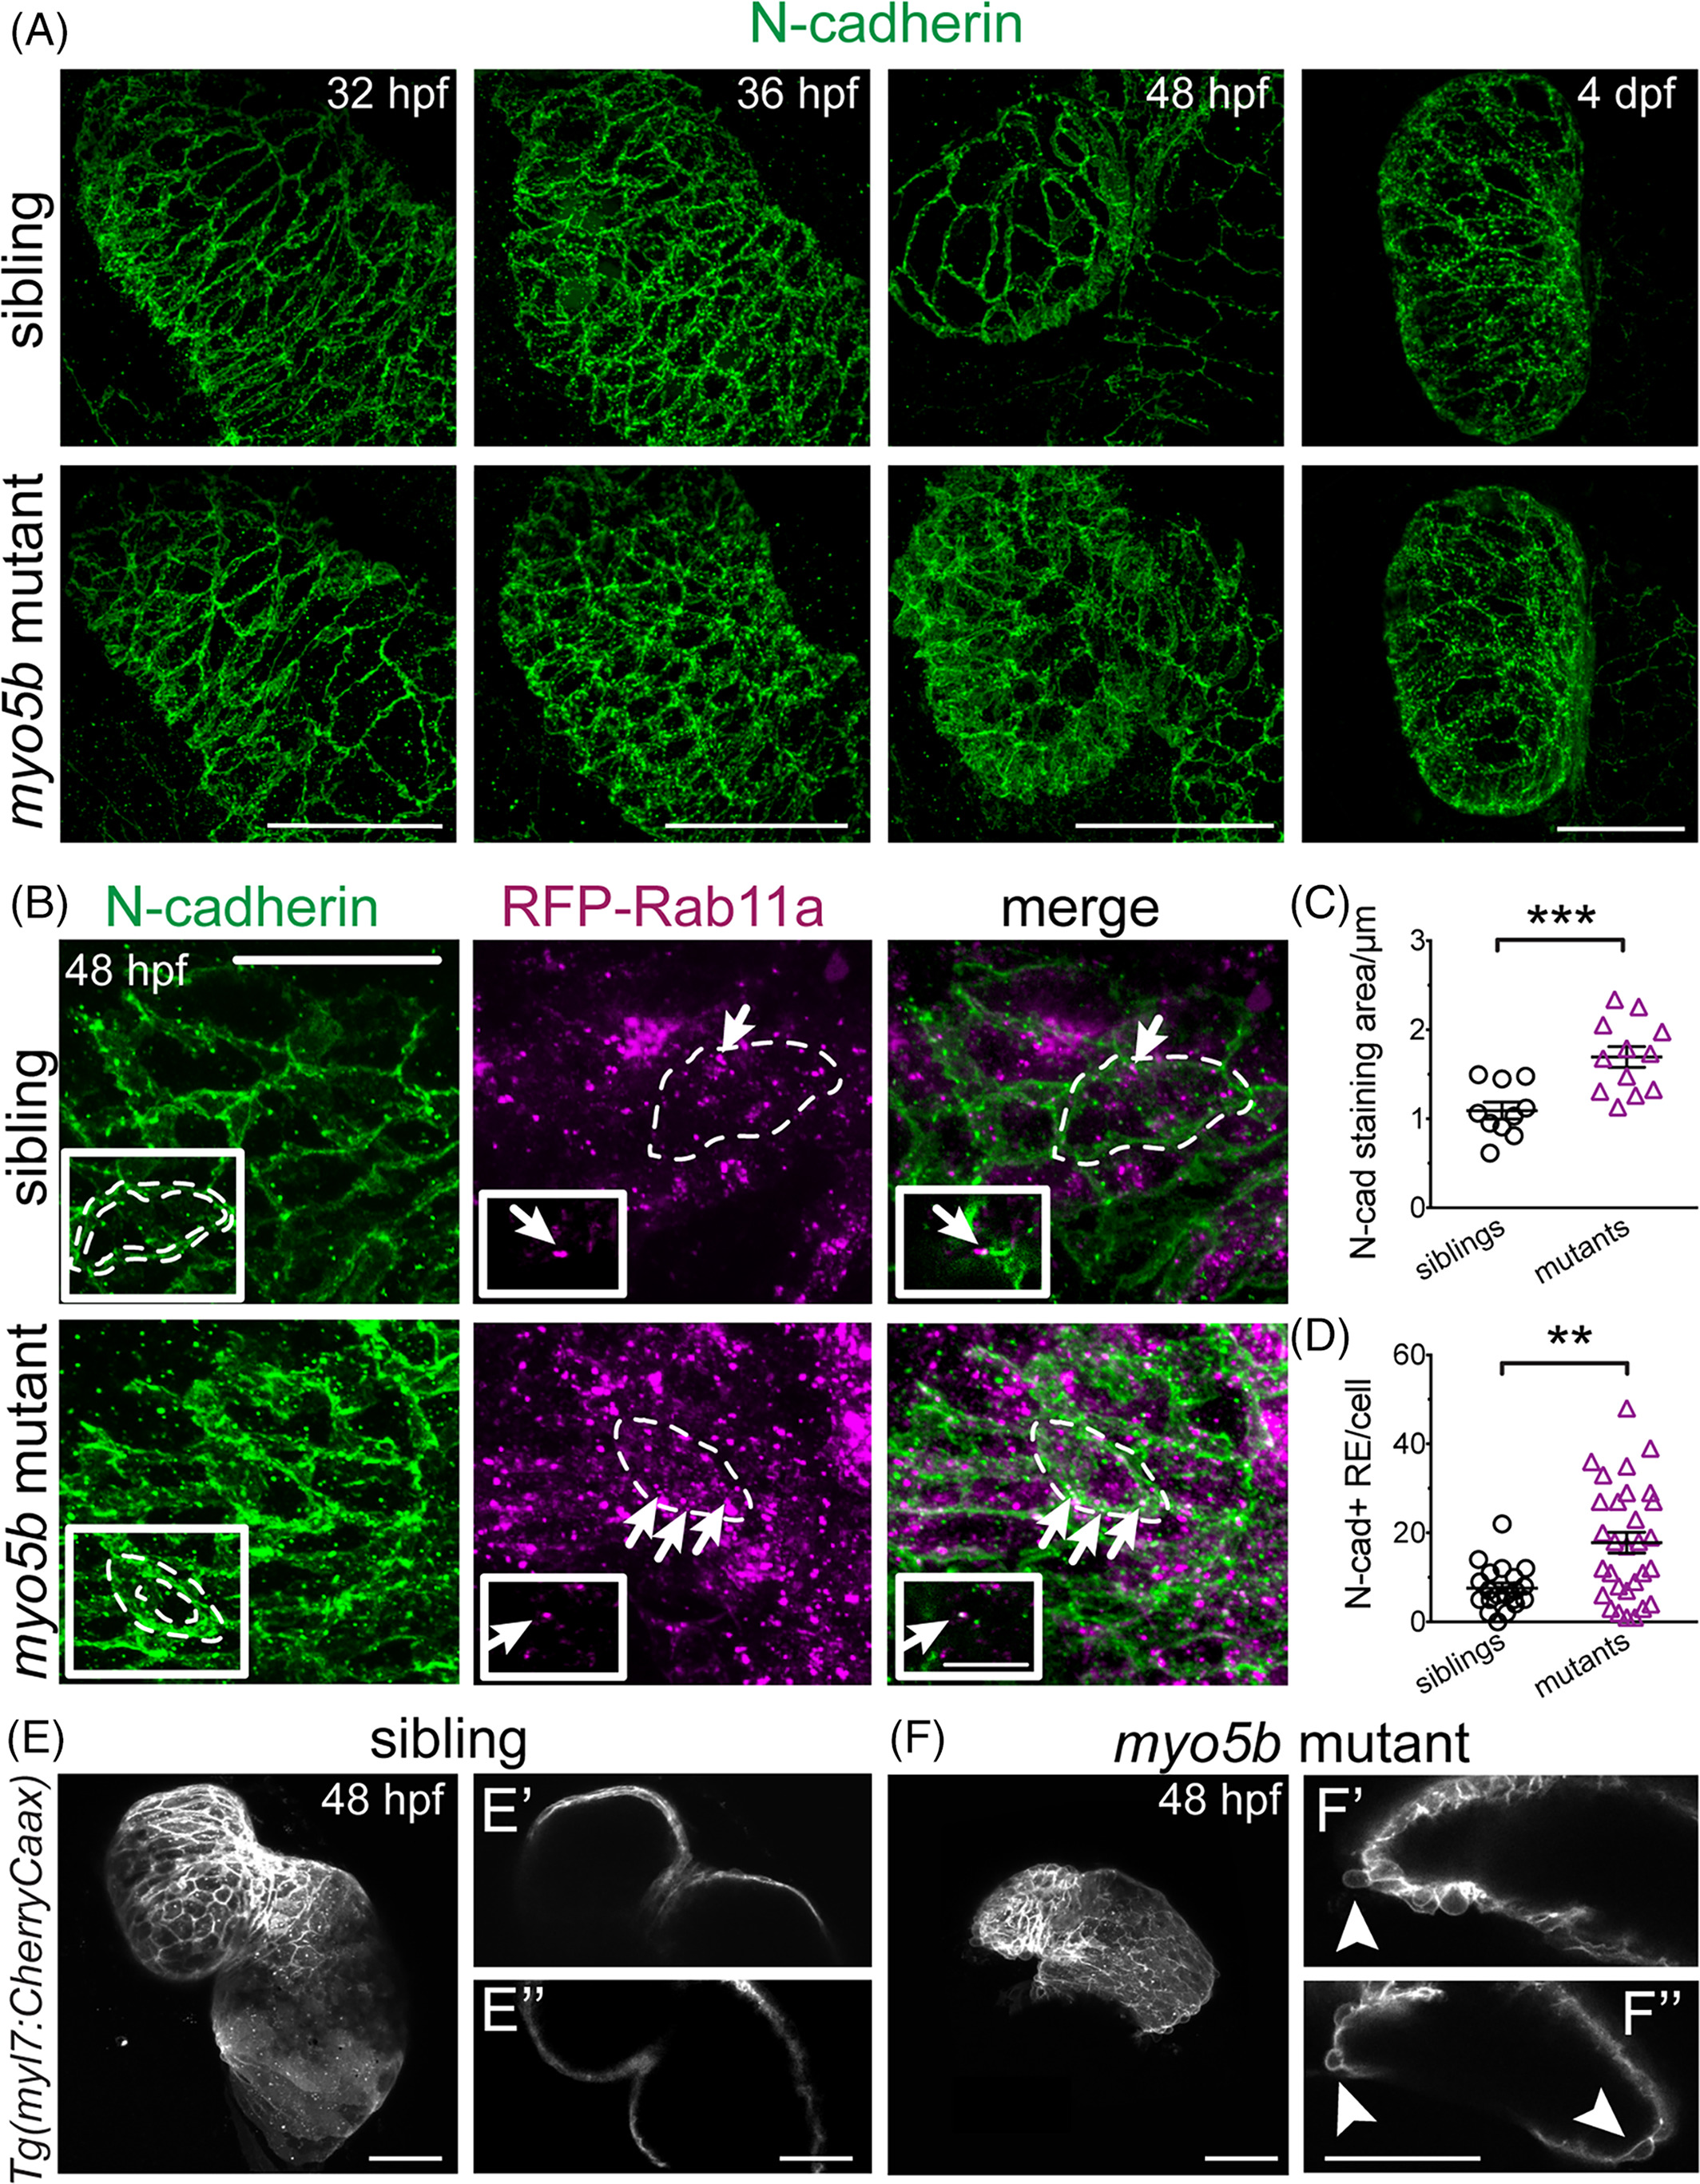
N?cadherin is mislocalized in myo5b mutants and is increased in recycling endosomes. A:Time?course imaging of N?cadherin localization in sibling and myo5bmutant hearts at 32, 36, 48 hpf, and 4 dpf, shows N?cadherin localization becoming disorderly at 36 hpf and clearly disorganized at 48 hpf. B: N?cadherin staining in RFP?Rab11a?expressing hearts at 48 hpf shows N?cadherin staining appears thicker (dotted perimeters in inset), consistent with persistence at the cytoplasm periphery. Co?localization between RFP?Rab11a and N?cadherin staining (arrows), showing N?cadherin localization within recycling endosomes. Mutant only insets: Single z?scan showing N?cadherin co?localizing with RFP?Rab11a (arrow) on the same confocal plane (Scale bar = 10 μm). C:Quantification of N?cadherin staining area, normalized to cell size, shows significantly increased N?cadherin staining area. D:Quantification of N?cadherin and recycling endosome (RE) co?localization shows significantly increased number of N?cadherin?positive recycling endosomes. mean ± s.e.m. *P < 0.05, **P < 0.01, ***P < 0.005. E,F:Live confocal z?stack imaging of Tg(myl7:CherryCaax)transgenic sibling and myo5bmutant embryos at 48 hpf showing observable cell extrusions in mutant heart. Single z?scans show no evident cell extrusions (E′,E″); however, single z?scans from mutant embryos show several examples of cells extruding from the myocardial layer (F′,F″, arrowheads). These cell extrusions were observed in all mutant embryos imaged (n = 11) and not observed in any sibling controls (n = 5).

