Fig. 1
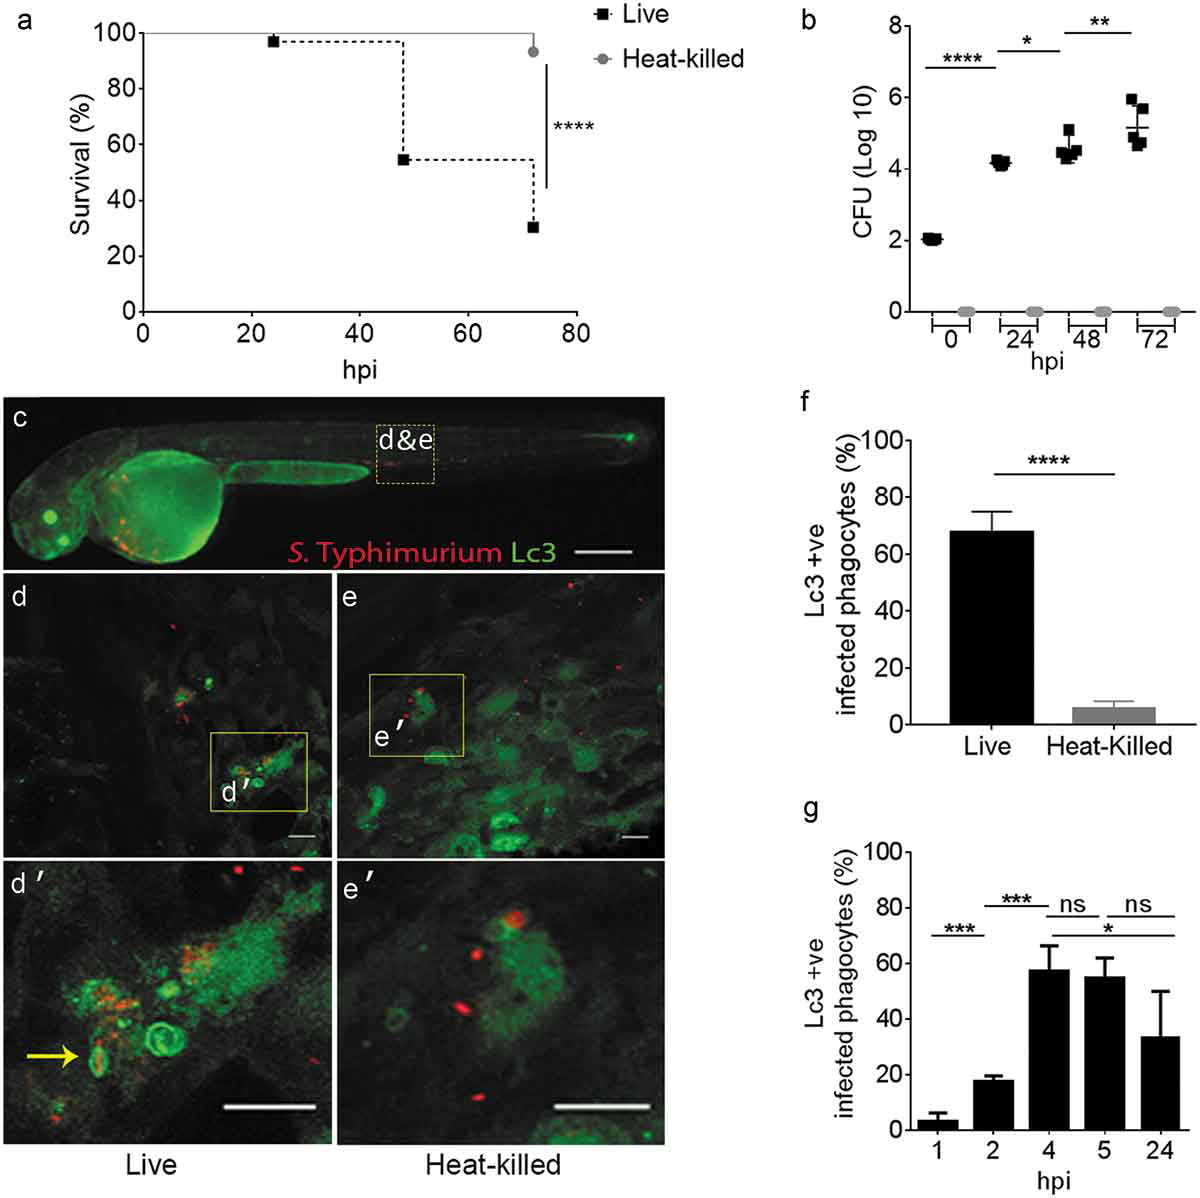
GFP-Lc3 recruitment to Salmonella during systemic infection of zebrafish. (a) Survival curves of Tg(CMV:GFP-map1lc3b) zebrafish embryos/larvae, systemically infected at 2 dpf by caudal vein injection with either live or heat-killed S. Typhimurium. One representative of three replicates is shown (n = 50 embryos per group). (b) CFU counts of the zebrafish infected with live or heat-killed S. Typhimurium. Five embryos/larvae per time point were used and the log-transformed CFU data are shown with the geometric mean per time point. One representative of three replicates is shown. (c) Stereo fluorescence image of a 2 dpf Tg(CMV:GFP-map1lc3b) embryo, systemically infected with live mCherry-expressing S. Typhimurium. The yellow dotted box shows the area in the tail used for Z-stack confocal imaging in d and e. (d and e) Representative confocal images at maximum projection taken at 4 hpi from time lapses recorded of embryos injected with live S. Typhimurium (e) or heat-killed S. Typhimurium (f) bacteria (see Movie M1 for live and M2 for heat-killed bacteria). Yellow boxes indicate the magnified regions shown in d’ and e’. The arrow in d’ indicates a ring-shaped structure of GFP-Lc3 signal enclosing an mCherry-expressing S. Typhimurium cell and several other GFP-Lc3-Salmonella associations can be observed in this image. (f) Quantification of GFP-Lc3-Salmonella associations at 4 hpi. Embryos injected with live or heat-killed S. Typhimurium were imaged over the yolk sac circulation valley region and quantified for percentages of phagocytes positive for GFP-Lc3-Salmonella associations (Lc3+ ve) over the total number of phagocytes with ingested bacteria. Error bars represent the SD. One representative of three replicates (each with n = 5 embryos per group) is shown. (g) Quantification of time course associations of GFP-Lc3-Salmonella during systemic infection with live S. Typhimurium. Five embryos per time point were imaged and quantified for percentages of phagocytes with GFP-Lc3-Salmonella associations as in f. Error bars represent the SD. Scale bars: c = 200 μm, d, e, d’ and e’ = 10 μm. ****P < 0.0001, ***P < 0.001, **P < 0.01, *P < 0.05, ns = non-significant.

