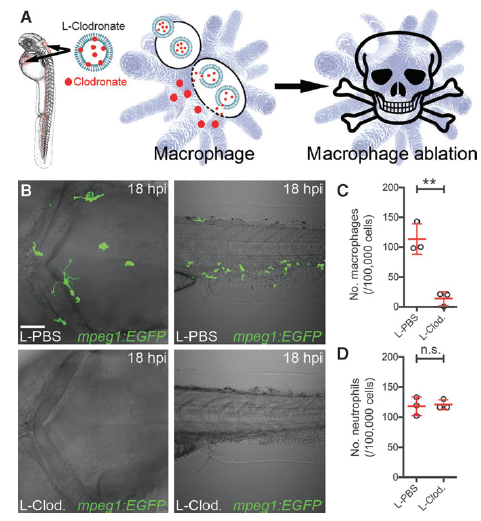
Fig. S1
Macrophage ablation using liposomal clodronate. (A) Schematic illustrating injection of liposomal clodronate into the sinus venosus and hindbrain ventricle of larval zebrafish to target clodronate to macrophages for macrophage ablation. (B) Live imaging of the hindbrain (dorsal view) and CHT (lateral view) after injection of liposomal clodronate (L-Clod.) or liposomal PBS (L-PBS) into 30 hpf Tg(mpeg1:EGFP) larvae, imaged at 18 hours postinjection (hpi). (C , D) Flow cytometry quantification of macrophages (C ) and neutrophils (D ) from dissociated 2 dpf (18 hpi) liposomomal PBS- and liposomal clodronate-injected Tg(mpeg1:EGFP) (C ) and Tg(lyz:EGFP) (D ) larvae (n = 3 biological replicates, * 30 larvae per group). All views anterior to left. Error bars display mean – SD. **P < 0.01, Student’s t -test. Scale bar, 50 l m in (B) . n.s., not significant. CHT, caudal hematopoietic tissue; dpf, days post fertilization; hpf, hours post fertilizaton

