Fig. 1
Vitamin D Analogs Promote Cardiomyocyte Proliferation in Zebrafish
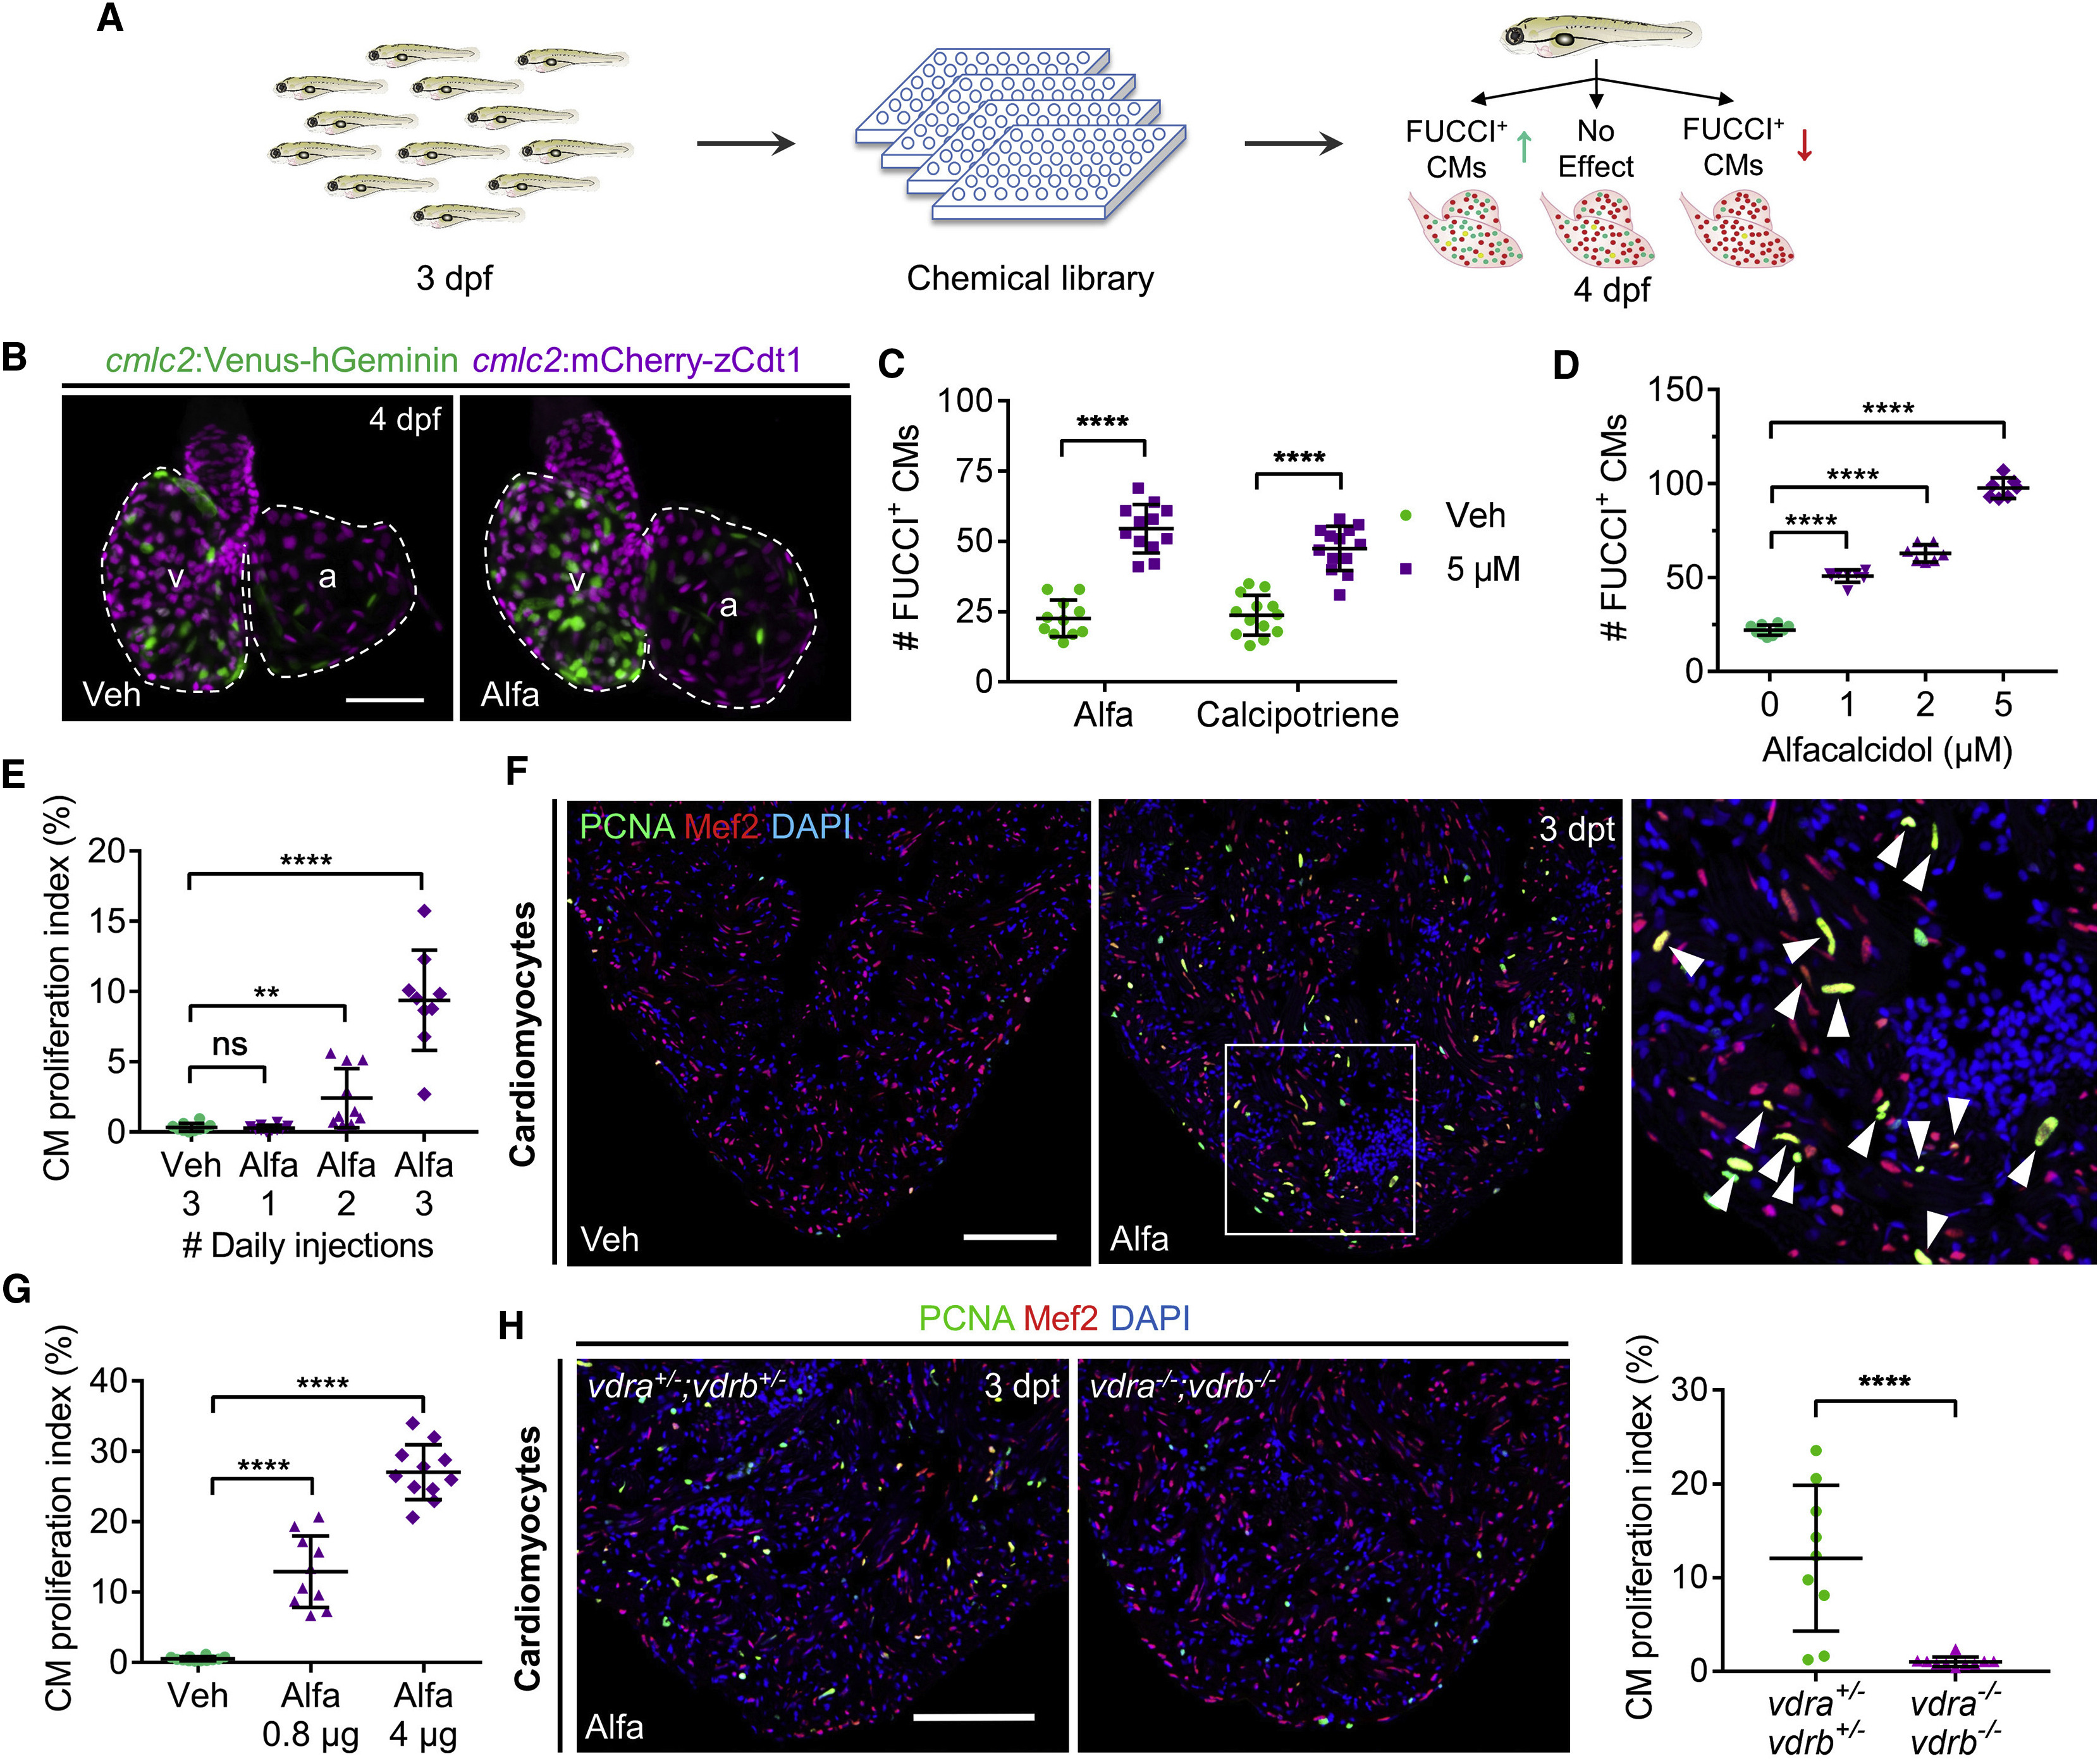
(A) Cartoon schematic of in vivo chemical screen for regulators of CM proliferation using cmlc2:FUCCI zebrafish embryos. dpf, days post-fertilization.
(B) Maximum intensity projection (MIP) images of dissected cmlc2:FUCCI hearts. Veh, vehicle; v, ventricle; a, atrium. Scale bar, 50 μm.
(C) Quantification of FUCCI+ CMs after 24-h treatment. Mean ± SD, Mann-Whitney test and Student’s t test. ∗∗∗∗p < 0.0001. n = 11–13.
(D) Quantification of FUCCI+ CMs after 24-h treatment. Mean ± SD, Mann-Whitney test and Student’s t test. n = 7–10.
(E) Quantification of adult ventricular CM proliferation indices. Mean ± SD, Mann-Whitney test and Student’s t test. ns, not significant; ∗∗p < 0.01. n = 9–10.
(F) Representative images of PCNA/Mef2 staining quantified in (E). Boxed area is enlarged on the right. Arrowheads indicate PCNA+CMs. dpt, days post-treatment. Scale bar, 100 μm.
(G) Ventricular CM proliferation indices of vehicle- or Alfa-injected adult zebrafish. Mean ± SD, Mann-Whitney test and Student’s t test. n = 10–12.
(H) Representative images and quantification of ventricular PCNA/Mef2 staining. Mean ± SD, Mann-Whitney test. n = 9–10. Scale bar, 100 μm.
Reprinted from Developmental Cell, 48(6), Han, Y., Chen, A., Umansky, K.B., Oonk, K.A., Choi, W.Y., Dickson, A.L., Ou, J., Cigliola, V., Yifa, O., Cao, J., Tornini, V.A., Cox, B.D., Tzahor, E., Poss, K.D., Vitamin D Stimulates Cardiomyocyte Proliferation and Controls Organ Size and Regeneration in Zebrafish, 853-863.e5, Copyright (2019) with permission from Elsevier. Full text @ Dev. Cell

