
|
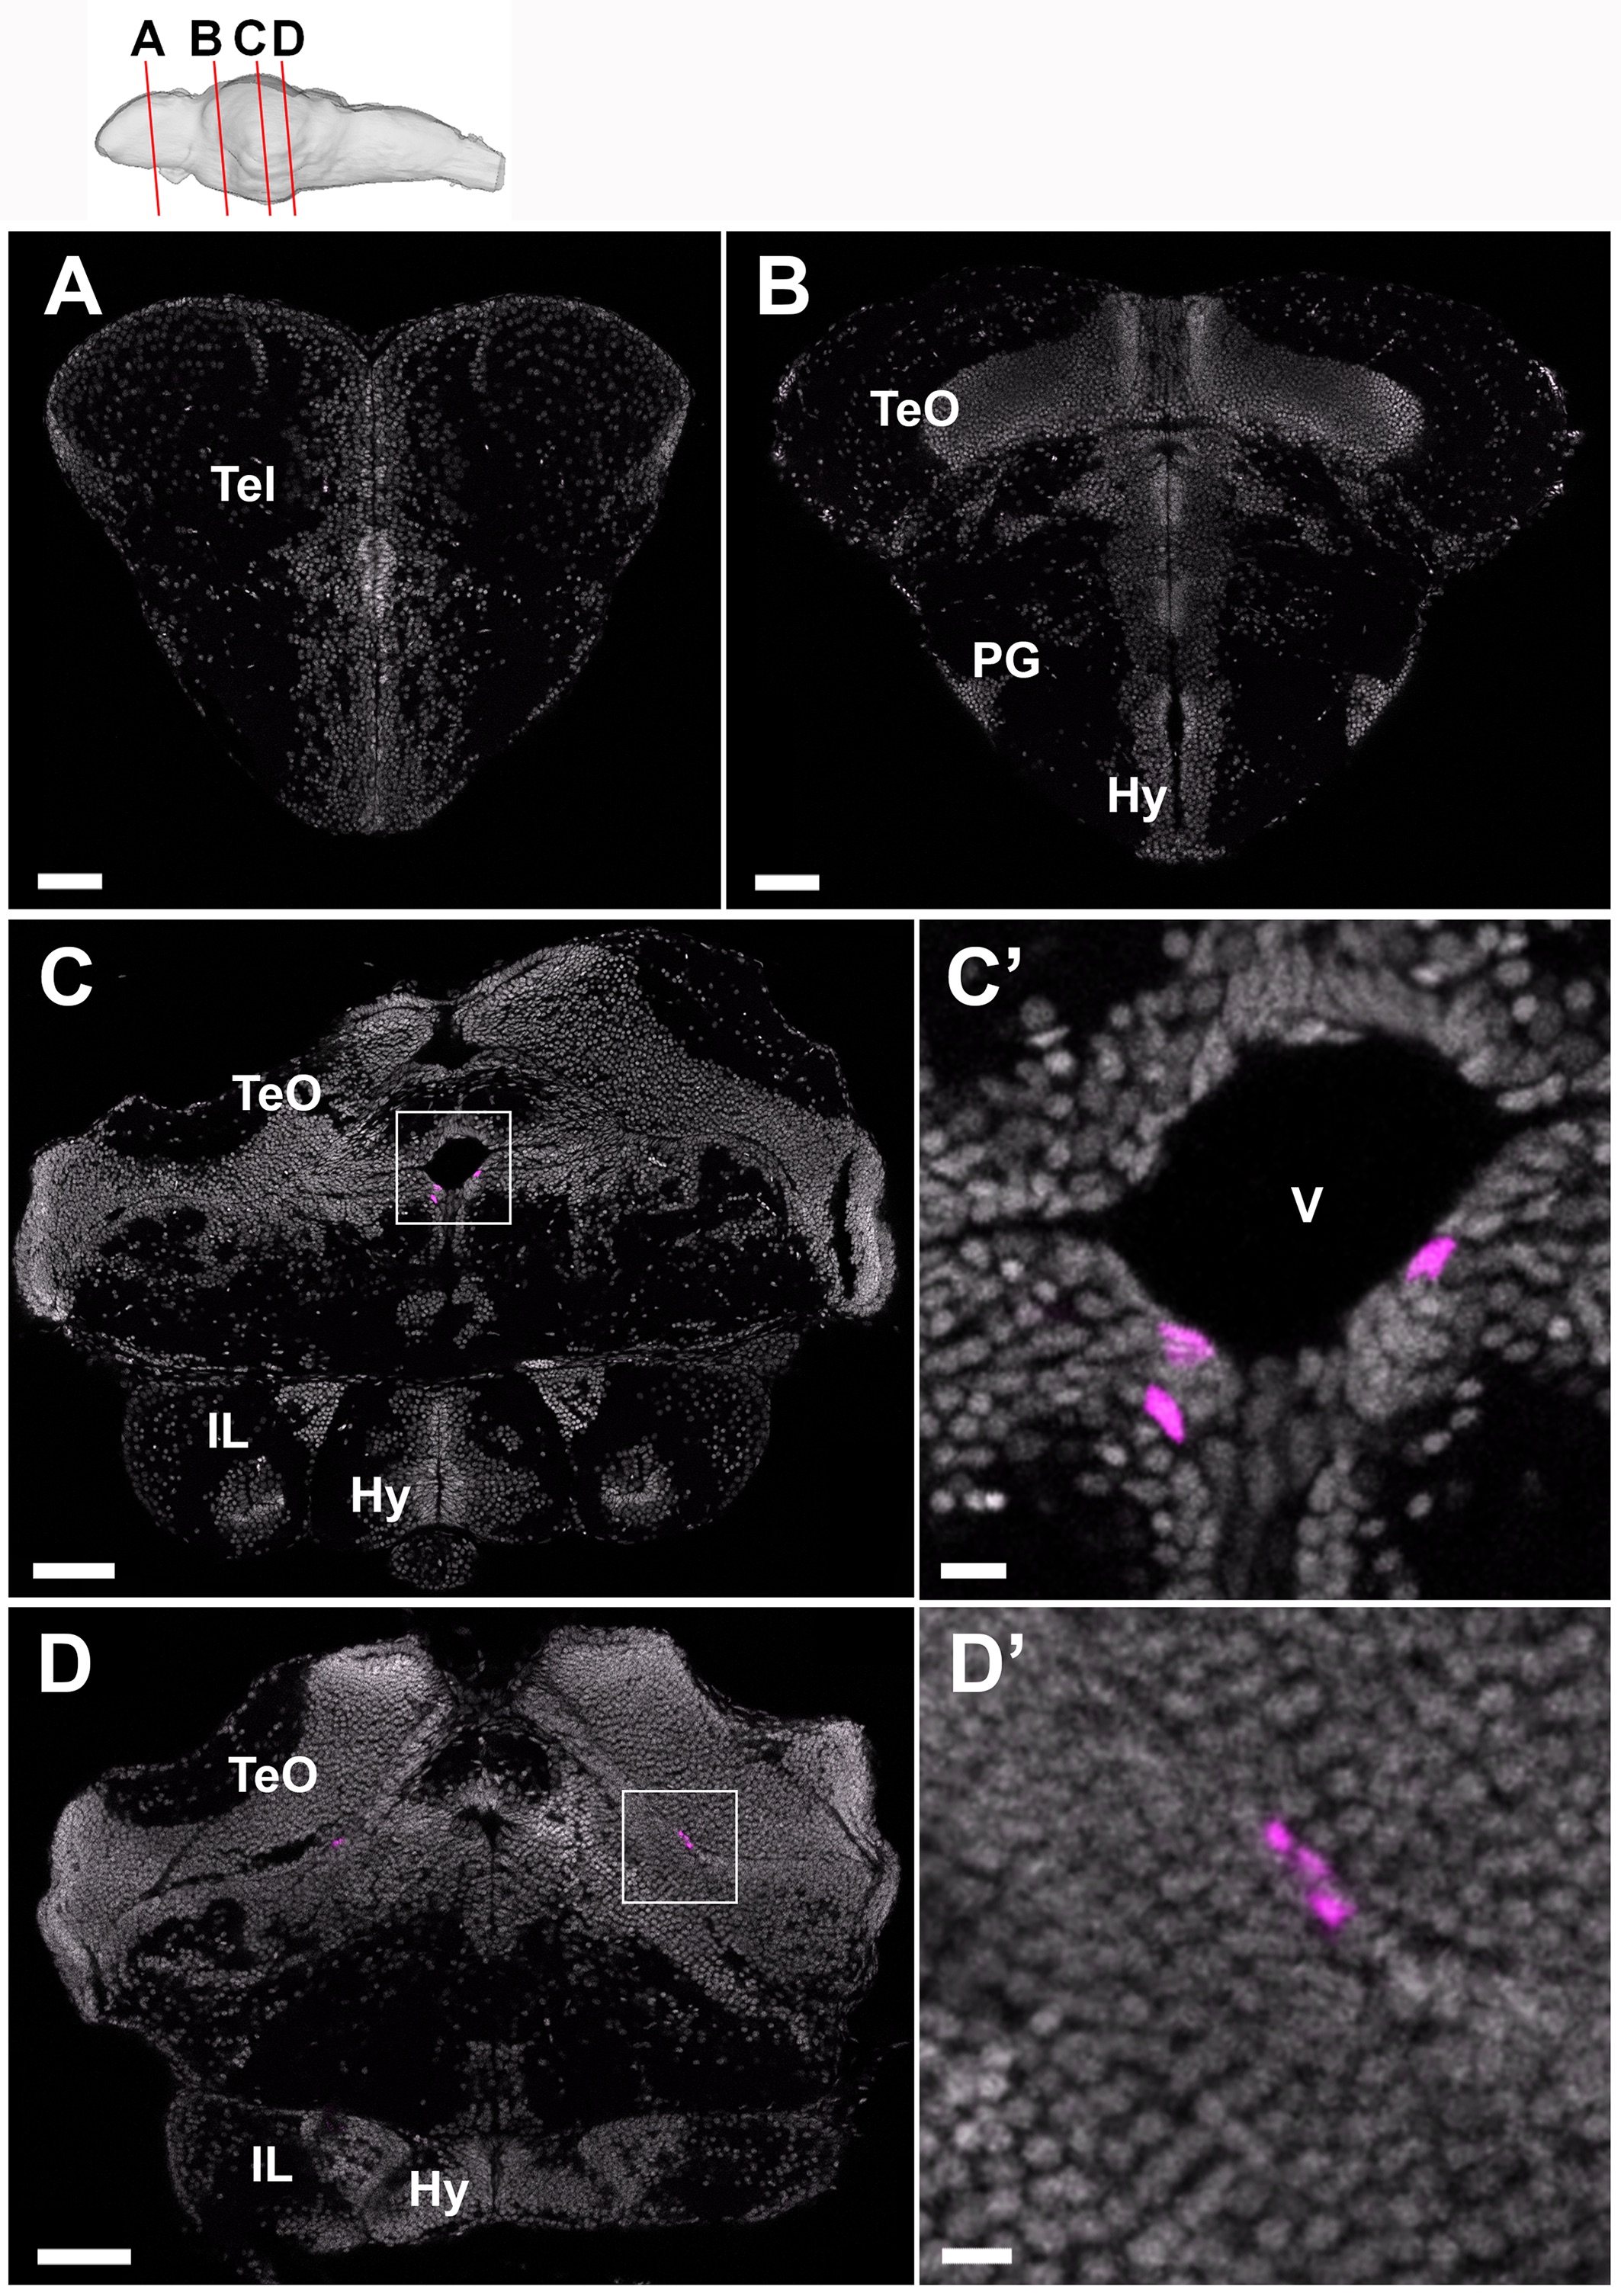
Fig. S4
Short-term tracing of tamoxifen-induced mCherry-positive cells in the Tg(her5:ERT2CreERT2;βact:lox-stop-lox-hmgb1:mCherry) juvenile zebrafish brain. Frontal sections of a 4 wpf brain, showing mCherry-positive cells in magenta and DAPI nuclear labeling in gray. The plane of each section is indicated in the schematic drawing on the top. A, B Anterior brain sections containing forebrain regions where there is no mCherry-positive cell. C, D More posterior brain sections containing mesencephalic regions where a few mCherry-positive cells are found close to the tectal ventricular zone. C’ and D’ show the area squared in C and D at a higher magnification. Scale bar: 60 μm for A and B, 100 μm for C and D, and 10 μm for C’ and D’. Abbreviation, Hy: hypothalamus, IL: inferior lobe, PG: preglomerular nucleus, Tel: telencephalon, TeO: optic tectum, V: ventricle. (TIF 18788 kb)