
|
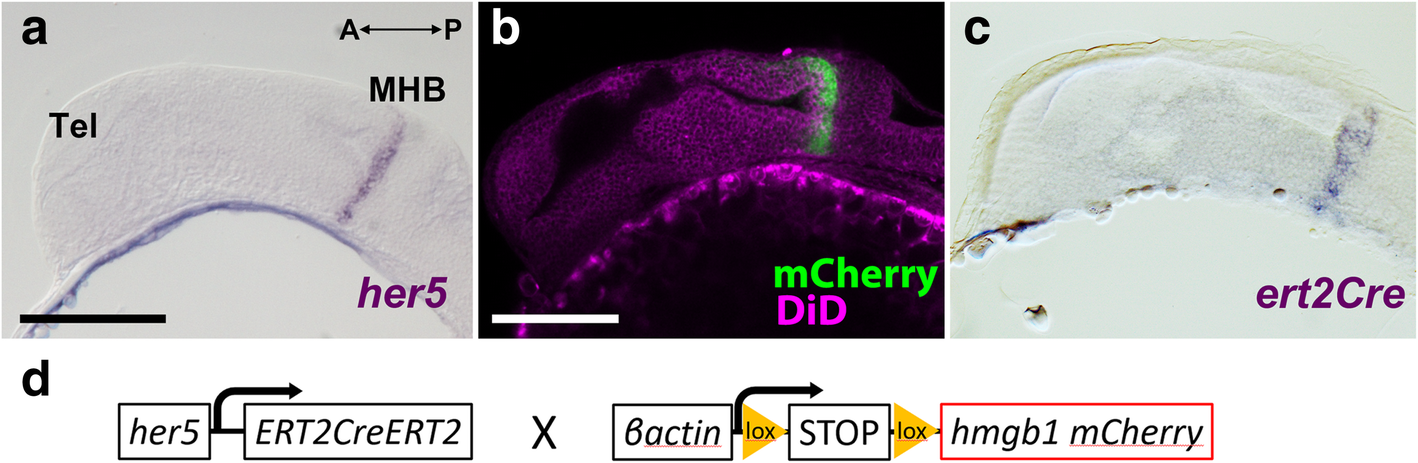
Fig. 2
Verification of the expression profile of the zebrafish transgenic line used in this study. a–c Sagittal sections of 24 hpf embryos showing that expression of her5 and ert2Cre is restricted to the MHB. The anterior part of the embryo is on the left. a In situ hybridization (ISH) of her5 confirms its specific expression in the MHB (purple). b Expression of mCherry (green) in a transgenic line Tg(her5:mCherry), which is identical to the her5 ISH pattern. The morphology is shown with DiD fiber labeling (magenta). c The expression pattern of ert2Cre is also identical to the her5 ISH (a) and mCherry in Tg(her5:mCherry) (b). d A simplified schema of the constructs of Tg(her5:ERT2CreERT2)and Tg(βact:lox-stop-lox-hmgb1:mCherry) which were used in this cell lineage study. Scale bars, 100 μm. Abbreviations: MHB midbrain-hindbrain boundary, Tel telencephalon