
|
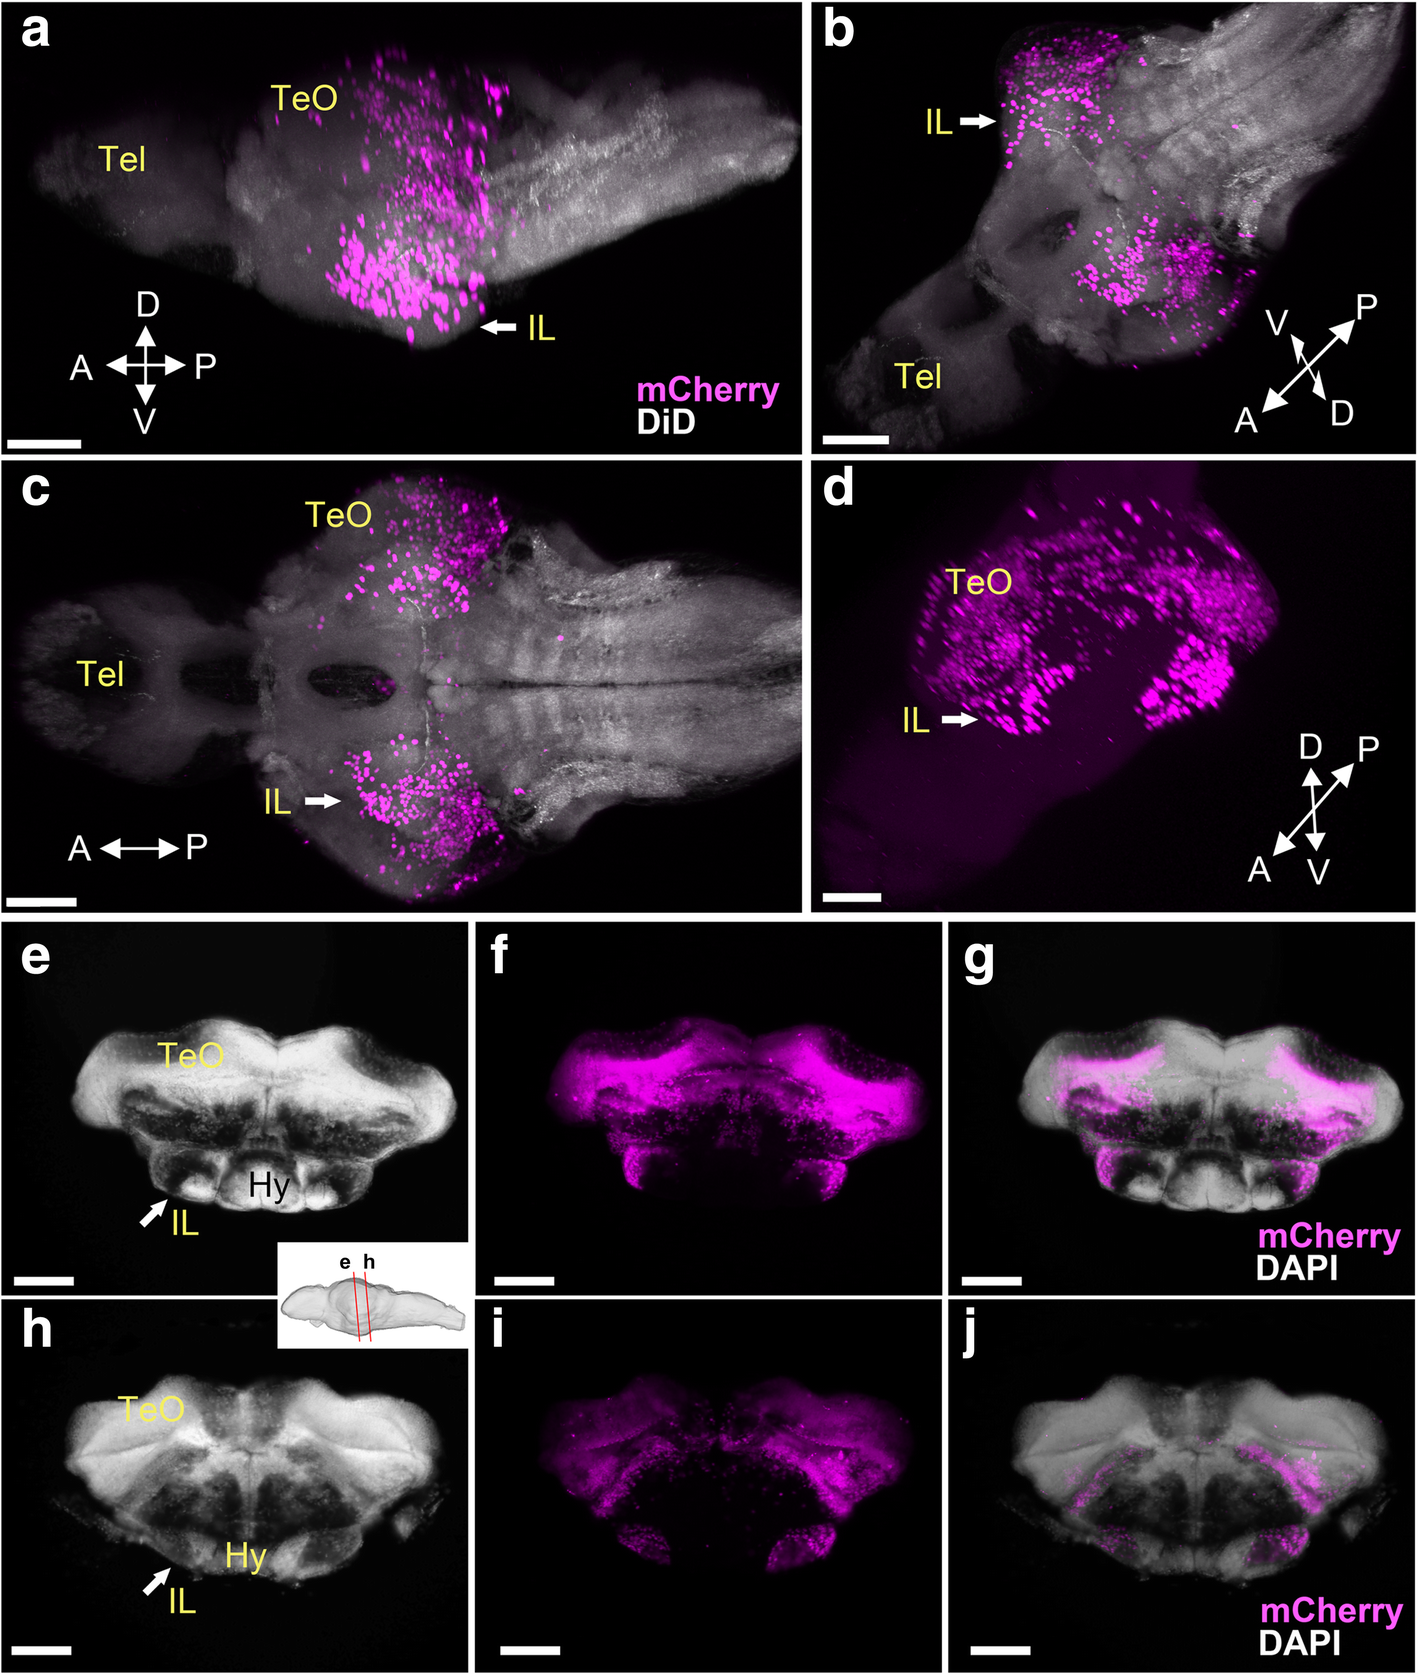
Fig. 5
Localization of the mCherry-positive cells in late larval brains of Tg(her5:ERT2CreERT2;βact:lox-stop-lox-hmgb1:mCherry) zebrafish treated with tamoxifen at 24 hpf. a–d 3D reconstruction from confocal images of a 14 dpf brain, showing mCherry-positive cells in magenta (a–d) and DiD fiber labeling in gray (a–c). Four different views are presented: lateral (a), ventral (c), and two different obliques (b, d). Arrows point at the IL on one hemisphere. The IL bulging can be seen in a and b, while d displays the continuity of the mCherry-positive cells in the IL with other midbrain structures. e–j Frontal sections of a 19 dpf brain, showing mCherry-positive cells in magenta and DAPI nuclear labeling in gray. IL is clearly visible in frontal sections (arrows), at two different antero-posterior levels (indicated in sagittal view in the white box). Anteriorly (e–g) the mCherry-positive cells are on the lateral part of IL that appears continuous with more dorsal midbrain structures, while posteriorly (h–j) a cluster of the mCherry-positive cells is seemingly detached from the dorsal midbrain structures. At the posterior IL, most of the IL is mCherry positive. Scale bars, 80 μm. Abbreviations: Hy hypothalamus, IL inferior lobe, TeO optic tectum, Tel telencephalon