
|
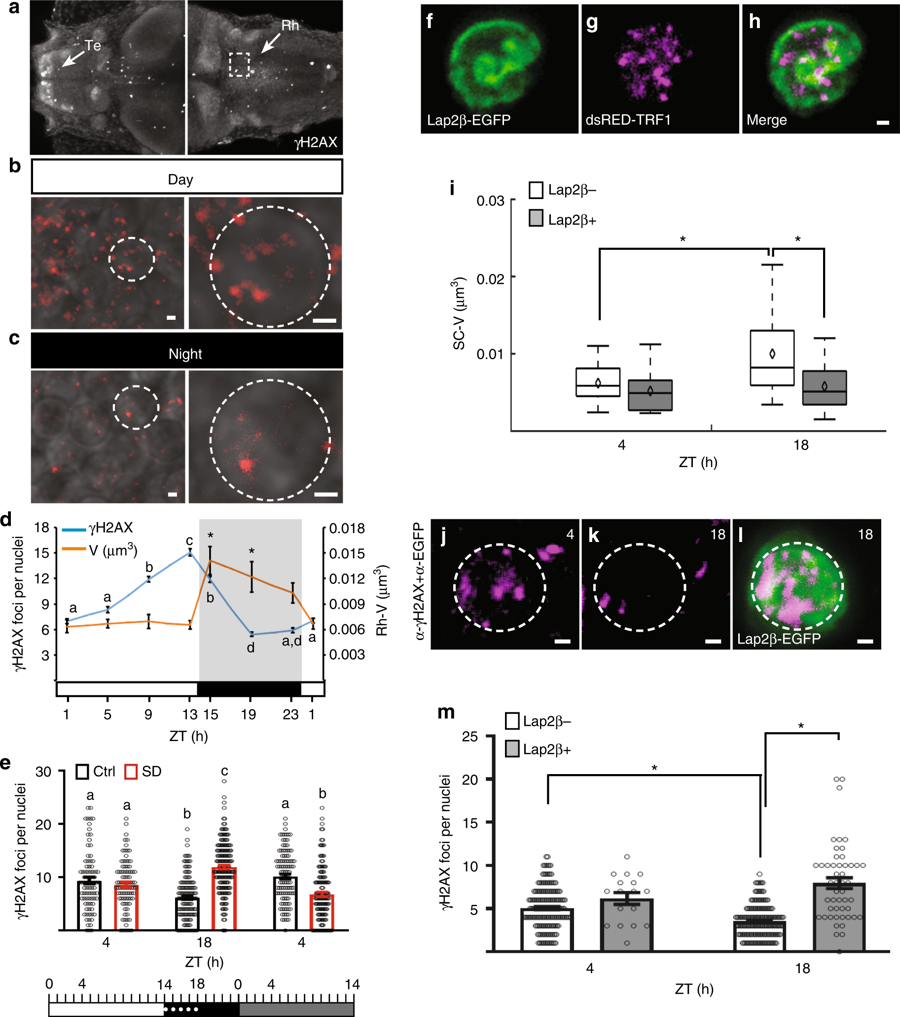
Fig. 3
Chromosome dynamics are essential for reducing the number of accumulating DSBs. a–c Dorsal view of 6 dpf larvae stained with γH2AX. a Arrows indicate the telencephalon (Te) and rhombencephalon (Rh). Dashed box showing the Rh represents the area analyzed in d and e. Representative images from the Rh region during day (b) and night (c) are shown. Dashed circle indicates a single neuron. d The number of DSBs (P = 1 × 10⁻¹⁶, F = 118, degrees of freedom = 7) and chromosome dynamics (*P = 8 × 10⁻⁷, F = 7, degrees of freedom = 7) in single nuclei over 24 h, in 14 h light/10 h dark cycle. Determined by one-way ANOVA followed by a Tukey test. Lower case letters indicate significant changes between γH2AX groups. Asterisks indicate significant changes between chromosome dynamics groups. White and black horizontal bars represent light and dark periods, respectively. e Numbers of DSBs (dot plot, means ± SEM). Ctrl: day (n = 83 cells), night (n = 131 cells), subjective day (n = 105 cells). SD: day (n = 86 cells), night (n = 170 cells), subjective day (n = 135 cells). P = 1 × 10⁻⁶, F = 62.04, degrees of freedom = 2, determined by two-way ANOVA followed by a Tukey test. White, black, and gray rectangles represent day, night, and subjective day, respectively. Dotted white line represents the sleep deprivation (SD) period. f–h Co-expression of Lap2β-EGFP (f) and human telomeric markers (g) in SC-neuronal nucleus. i Volume of chromosome dynamics in control (Lap2β−, day: n = 25; night: n = 21 cells) and Lap2β-overexpressing cells (Lap2β+, day: n = 25; night: n = 19 cells). *P = 0.026, F = 5.1, degrees of freedom = 1, determined by two-way ANOVA followed by a Tukey test. j–l Representative images of double immunohistochemistry using α-γH2AX (magenta) and α-EGFP (green) in single SC neurons during day (j) and night (k, l). Dashed circle indicates a single nucleus. m The number of DSBs (dot plot, means ± SEM) in control (Lap2β−, day: n = 177; night: n = 177 cells) and Lap2β-overexpressing cells (Lap2β+, day: n = 17; night: n = 49 cells). *P = 1 × 10⁻⁶, F = 18.8, degrees of freedom = 1, determined by two-way ANOVA followed by a Tukey test. Zeitgeber time (ZT4)-day, ZT18-night. Boxplots: black diamond represents the mean, boxes indicate the median and the 25th-to-75th percentiles, whiskers extend to the most extreme data points. Letters or asterisks indicate significant differences. Scale bar = 1 µm