
|
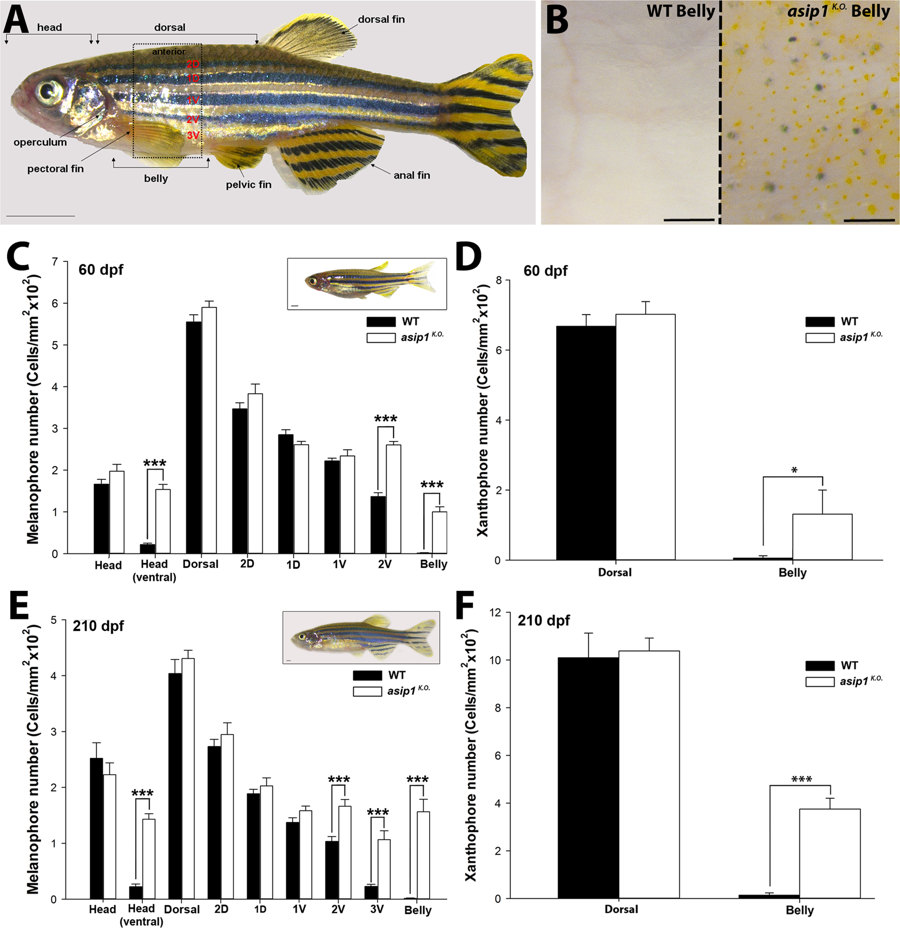
Fig. 4
Quantitation of dorsal-ventral distribution of melanophores and xanthophores in adult WT and asip1K.O.fish. (A) Lateral view of zebrafish showing the body regions selected for melanophore and xanthophore count. (B) Ventral view of the WT and asip1K.O. 210 dpf zebrafish fish belly. (C) Distribution and number of melanophores in WT and asip1K.O. 60 dpf fish. At this stage, asip1K.O. shows a significantly higher number of melanophores in the black stripe 2 V, ventral head and belly. (D) Number of xanthophores in the dorsal and ventral skin of WT and asip1K.O. 60 dpf fish. At this stage, asip1K.O. shows a significantly higher number of xanthophores in the belly region. (E) Distribution and number of melanophores in WT and asip1K.O. 210 dpf fish. At this stage, asip1K.O. shows significantly higher number of melanophores also in black stripe 2 V, 3 V, ventral head and belly. (F) Number of xanthophores in dorsal and ventral skin of WT and asip1K.O. 210 dpf fish. These fish showed highly significant higher number of xanthophores in belly region than WT. Data are the mean ± SEM, n = 7. Asterisks indicate significant differences between WT and asip1K.O. fish. Scale bar (A,C,E) 1 mm, (B) 100 μm.