Fig. 2
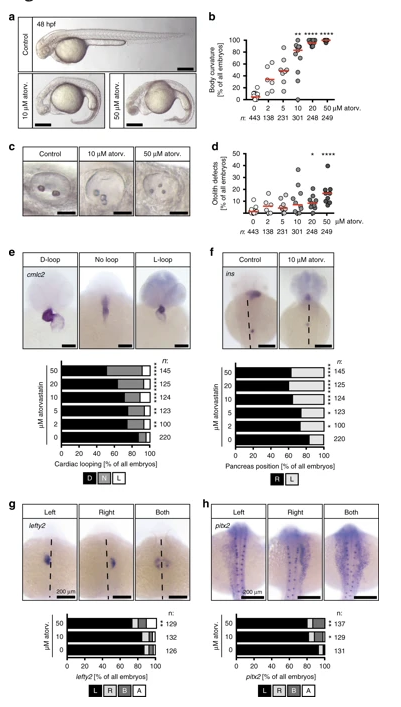
Atorvastatin provokes ciliopathy phenotypes. a Atorvastatin treatment results in embryos with curved bodies. Scale bar: 200 µm. b Body curvature worsens with increasing atorvastatin concentrations; n = 16 (0, DMSO), 6 (2 µM), 8 (5 µM), 11 (10 µM), 9 (20 µM), 9 (50 µM); **p < 0.01, ****p < 0.0001 (atorvastatin versus DMSO control treated embryos), Kruskal–Wallis test with Dunn’s multiple comparison test. c Live images of otic placodes at 48 hpf showing defects in otolith formation in atorvastatin-treated embryos. Scale bar: 50 µm. d Graph displaying the dose-dependent increase in otolith defects upon atorvastatin treatment; n = 15 (0, DMSO), 6 (2 µM), 8 (5 µM), 10 (10 µM), 9 (20 µM), 9 (50 µM); *p < 0.05, ****p < 0.0001 (atorvastatin versus control treated embryos), Kruskal–Wallis test with Dunn’s multiple comparison test. e Atorvastatin produces random heart looping. Images of cmlc2 in situ hybridization to visualize the whole heart at 48 hpf. Scale bar: 100 µm; n = 9 (0, DMSO), 6 (2, 5, 10, 20 and 50 µM); p = 0.0065 (2 µM), 0.0073 (5 µM), 0.0005 (10 µM), < 0.0001 (20 and 50 µM). f Pancreas placement becomes randomized upon atorvastatin treatment. Dorsal views of embryos processed by in situ hybridization for the endocrine pancreas marker insulin (ins). Dashed line indicates midline of embryo. Scale bar 200 µm. Stacked bar graph summarises 9 (DMSO) and 6 (atorv. concentrations) experiments; p = 0.0492 (2 µM), 0.0493 (5 µM), 0.0002 (10 µM), < 0.0001 (20 and 50 µM). g The leftward gene lefty2 is ambiguously expressed after atorvastatin treatment. L expression on left side, R right side, B both sides of midline (dashed), A absent expression. Scale bar: 200 µm; **p = 0.0072. h pitx2 is randomly expressed in the left and/or right lateral plate mesoderm after atorvastatin treatment. L expression on left side, R right side, B both sides of midline (dashed), A absent expression. Scale bar: 200 µm; *p = 0.0155, **p = 0.0071. b, d–h Number of individual embryos given below or next to graphs. e–h Two-tailed Fisher’s exact tests (atorvastatin versus control treated embryos)

