Image
Figure Caption
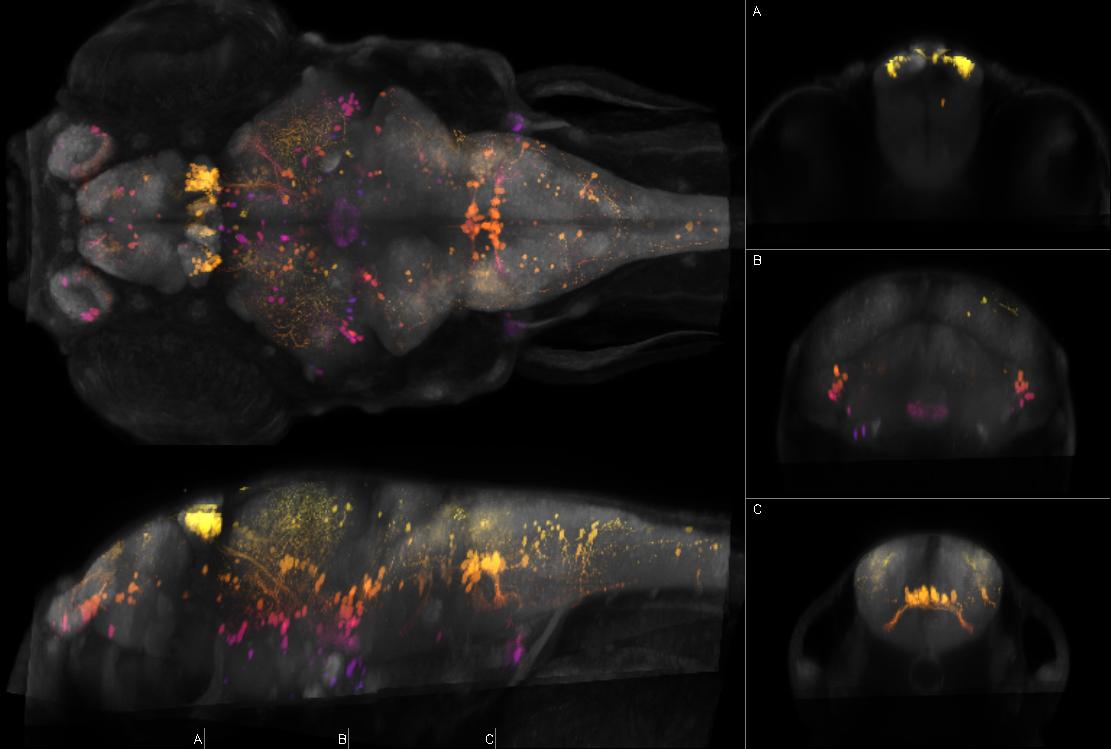
Fig.34 Left: dorsal and sagittal maximal confocal projections from Zebrafish Brain Browser. Right: coronal slices at the indicated levels. Depth coded by color. Intensity represents mean expression in larvae transgenic for y533Et and Tg(UAS:Kaede)s1999t which expresses Kaede in habenula (right, plus fasciculus retroflexus), floorplate, tegmentum, torus semicircularis, locus coeruleus, facial octavolateralis motor neurons (strong projections outside brain), fast muscle (moderate), lateral line nerve (hair cell junctions)
Figure Data

