
Image
|
Figure Caption
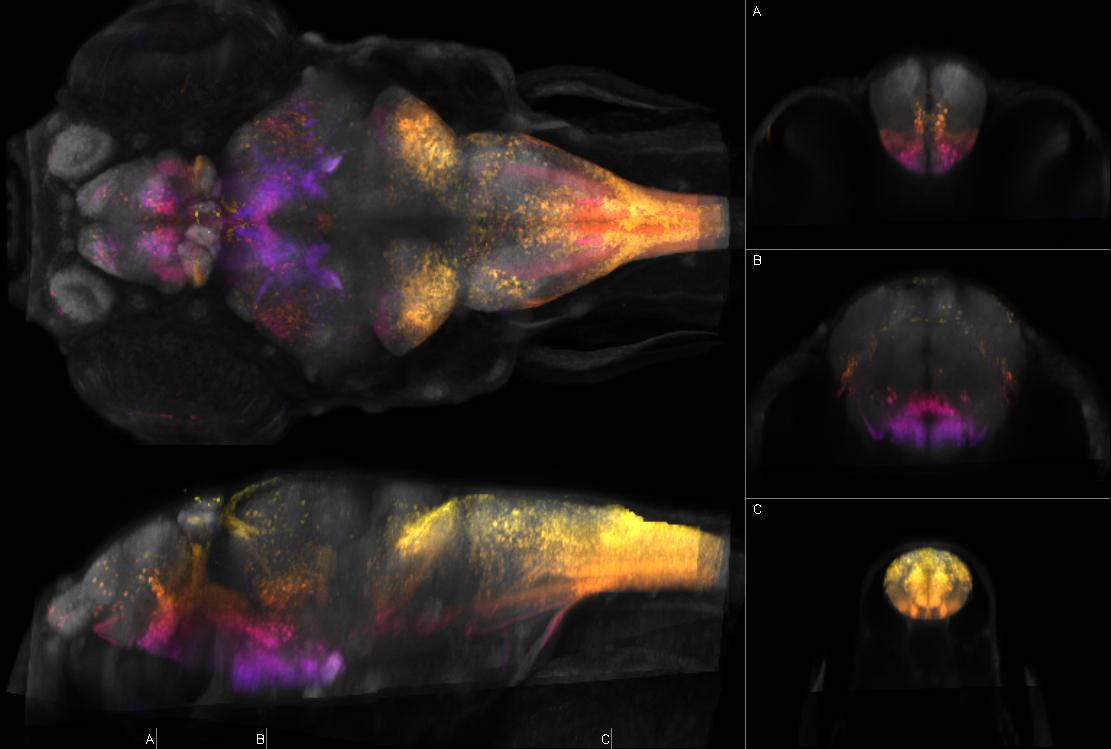
Fig.20 Left: dorsal and sagittal maximal confocal projections from Zebrafish Brain Browser. Right: coronal slices at the indicated levels. Depth coded by color. Intensity represents mean expression in larvae transgenic for y274Et and Tg(UAS:Kaede)s1999t which expresses Kaede in brain (broad), spinal cord (broad), notochord, heart, slow muscle, fins, ocular muscle
Figure Data