
Image
|
Figure Caption
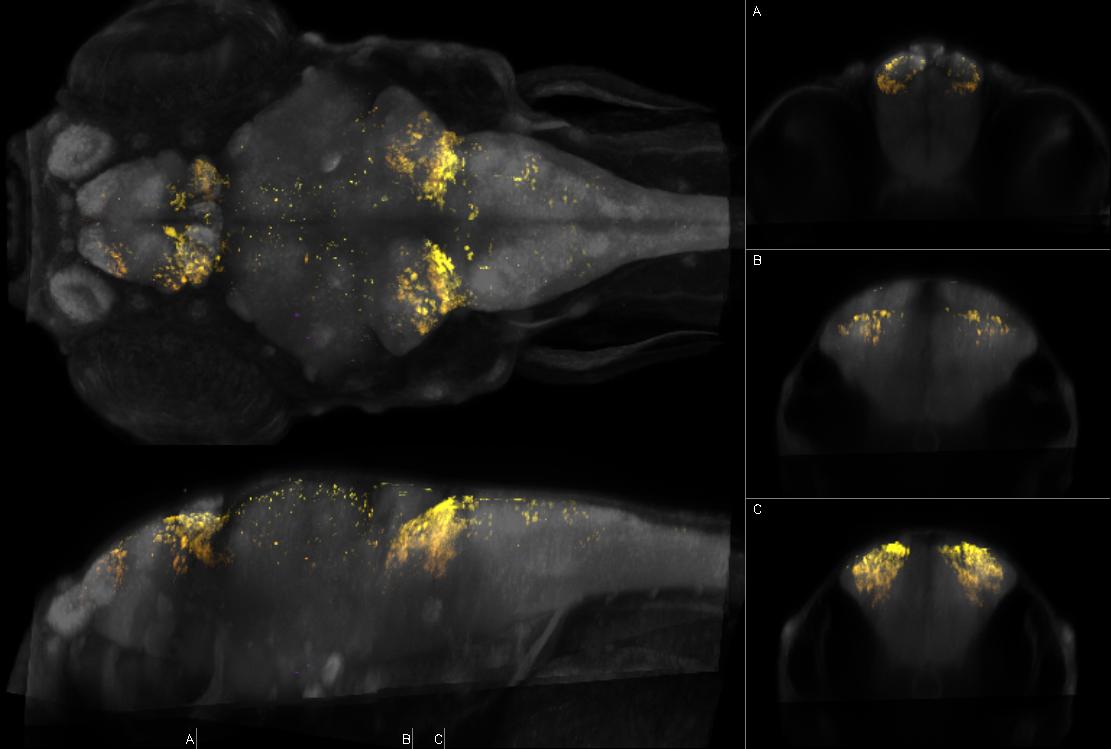
Fig.151 Left: dorsal and sagittal maximal confocal projections from Zebrafish Brain Browser. Right: coronal slices at the indicated levels. Depth coded by color. Intensity represents mean expression in larvae transgenic for y549Et and Tg(bActin:Switch)y252 which expresses TagRFPT in rhombomere 2, rhombomere 4
Figure Data