
Image
|
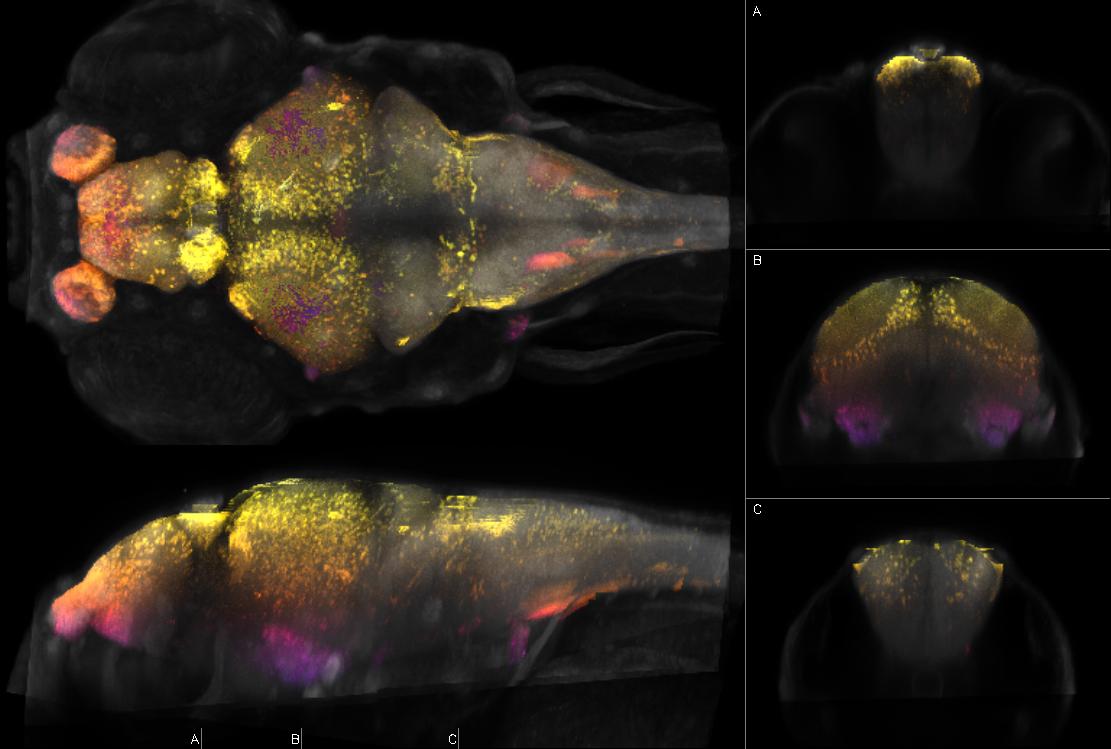
Figure Caption
Fig.118 Left: dorsal and sagittal maximal confocal projections from Zebrafish Brain Browser. Right: coronal slices at the indicated levels. Depth coded by color. Intensity represents mean expression in larvae transgenic for y483Et and Tg(bActin:Switch)y252 which expresses TagRFPT in olfactory epithelium, olfactory bulb, subpallium, habenula, optic tectum (cellular layer), hypothalamus - diffuse nucleus, rhombomere 4 (dorsal cluster)
Figure Data