
Image
|
Figure Caption
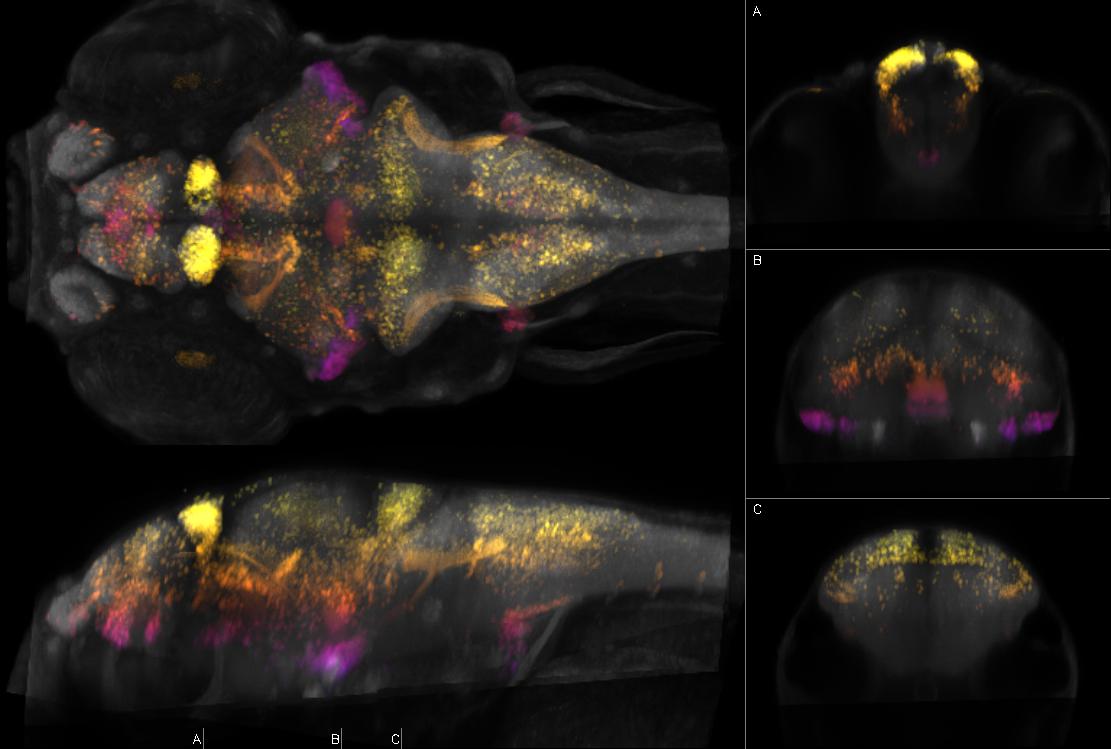
Fig.95 Left: dorsal and sagittal maximal confocal projections from Zebrafish Brain Browser. Right: coronal slices at the indicated levels. Depth coded by color. Intensity represents mean expression in larvae transgenic for y565Et and Tg(UAS:Kaede)s1999t which expresses Kaede in subpallium, medial habenula, thalamus, tegmentum, corpus cerebelli, cranial sensory ganglia, vagus motor neurons, inferior olive, aLLg (strong), pLLg, lateral line (branches to neuromasts), dorsal root ganglia (DRG), notochord (weak), muscle (weak)
Figure Data