
|
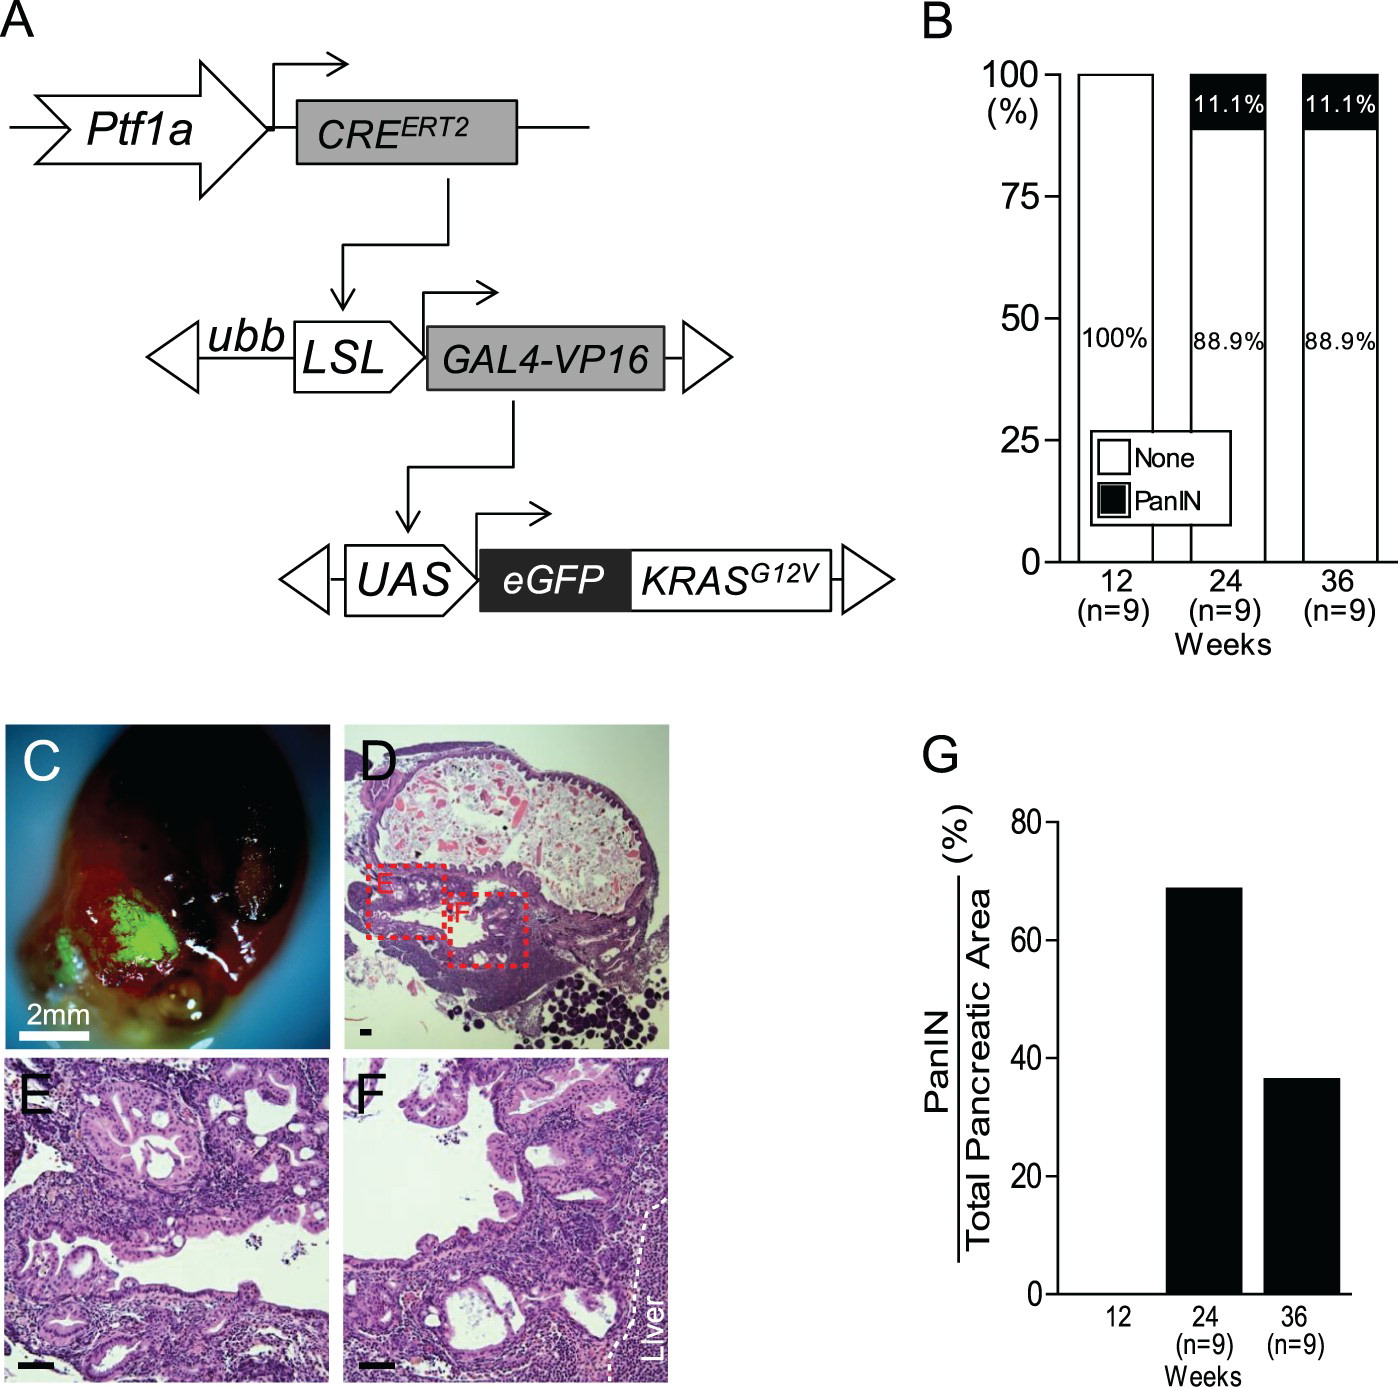
Fig. 1
Identification of tge PanIN region in Tg (ptf1a:CREERT2; LSL-GAL4; UAS-KRASG12V) fish. (A) Schematic of the ptf1a CRE-driver line,Tg (ptf1a:CREERT2), the CRE-responder line Tg (LSL-GAL4), and the GAL4-responder line Tg (UAS-KRASG12V). (B) Quantification of PanIN induction frequency in Tg (ptf1a:CREERT2; LSL-GAL4; UAS-KRASG12V) fish. (C) Dissected abdominal viscera with an eGFP-positive tumor from KRASG12V. Scale bars: 2 mm. (D–F) The histological profiles of tumors bear striking resemblance to human PanIN. Boxed areas indicate regions depicted at higher magnification in adjacent images. Scale bars: 50 μm. (G) Quantification of PanIN region vs. total pancreatic area in Tg (ptf1a:CREERT2; LSL-GAL4; UAS-KRASG12V) fish.