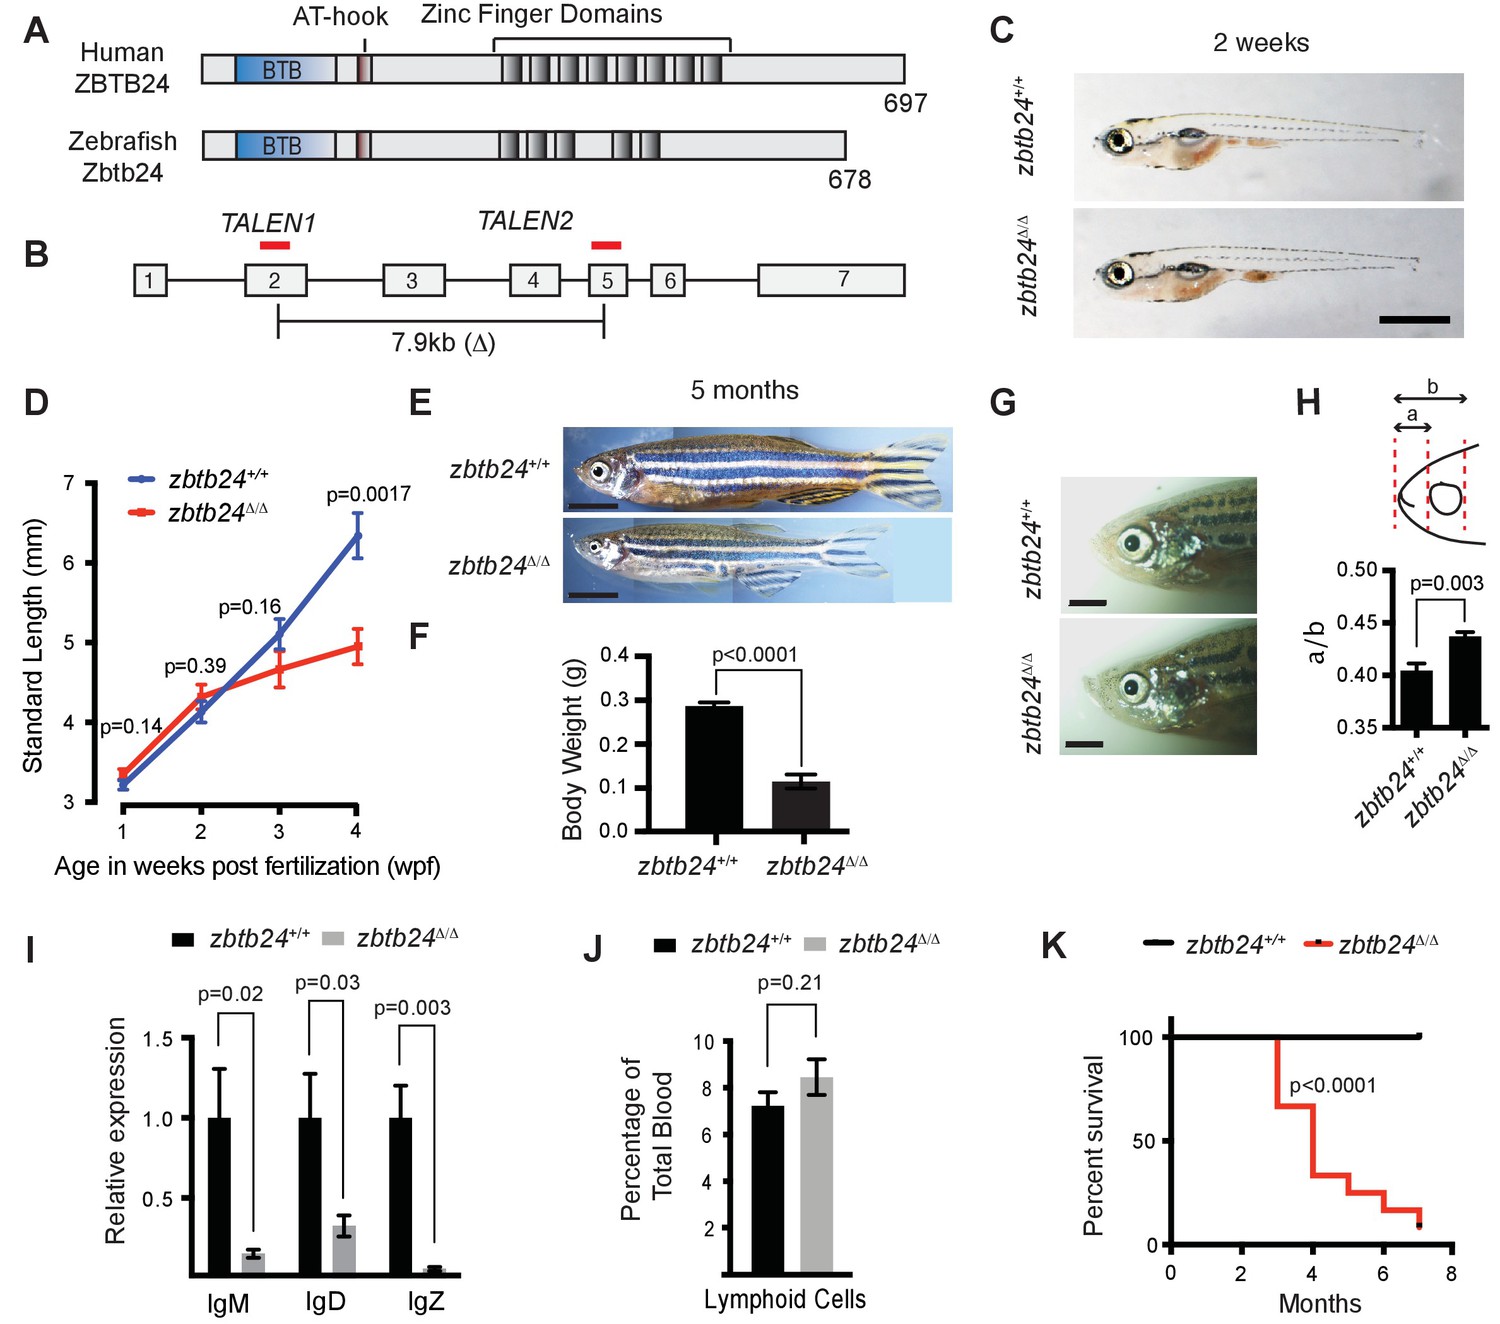
Fig. 1 Mutation of zbtb24 causes ICF syndrome-like phenotypes in zebrafish.
(A) Schematic of human and zebrafish Zbtb24 proteins. The BTB/POZ domain is indicated in blue and C2H2-type zinc fingers in dark grey. (B) Schematic of zebrafish zbtb24 gene. Location of TALEN target sequences are indicated in red (not to scale). Brackets indicate the region deleted by the zbtb24mk22(?) allele. (C) Representative images of zbtb24+/+ and zbtb24?/? zebrafish at 2 wpf. Scale bar: 1 mm. (D) Standard length measurements for zbtb24+/+ and zbtb24?/? zebrafish at 1, 2, 3 and 4 wpf (n ? 6 for each group). (E) Representative images of zbtb24+/+ and zbtb24?/? zebrafish at 5 months. Scale bar: 5 mm. (F) Average weight of zbtb24+/+ and zbtb24?/? zebrafish at 5 months (n = 5 for each group). (G) Representative images of facial abnormalities in zbtb24+/+ and zbtb24?/? adults at 6 months. Scale bar: 2 mm. (H) Schematic and quantification of facial abnormalities in zbtb24?/? zebrafish (n = 5 for each group). (I) Abundance of IgM, IgD and IgZ transcripts in zbtb24+/+ and zbtb24?/? zebrafish at 6 weeks post fertilization (n = 5 for each group). (J) Quantification of lymphoid cell populations in total blood isolated from zbtb24+/+ or zbtb24?/? kidney marrow from adults, measured by Forward/Side scatter flow cytometry (n = 11 for each group). (K) Kaplan-Meier curve indicating survival among groups of zbtb24+/+ and zbtb24?/? zebrafish (n = 12 for each group). All error bars indicate standard error of the mean (SEM).

