
|
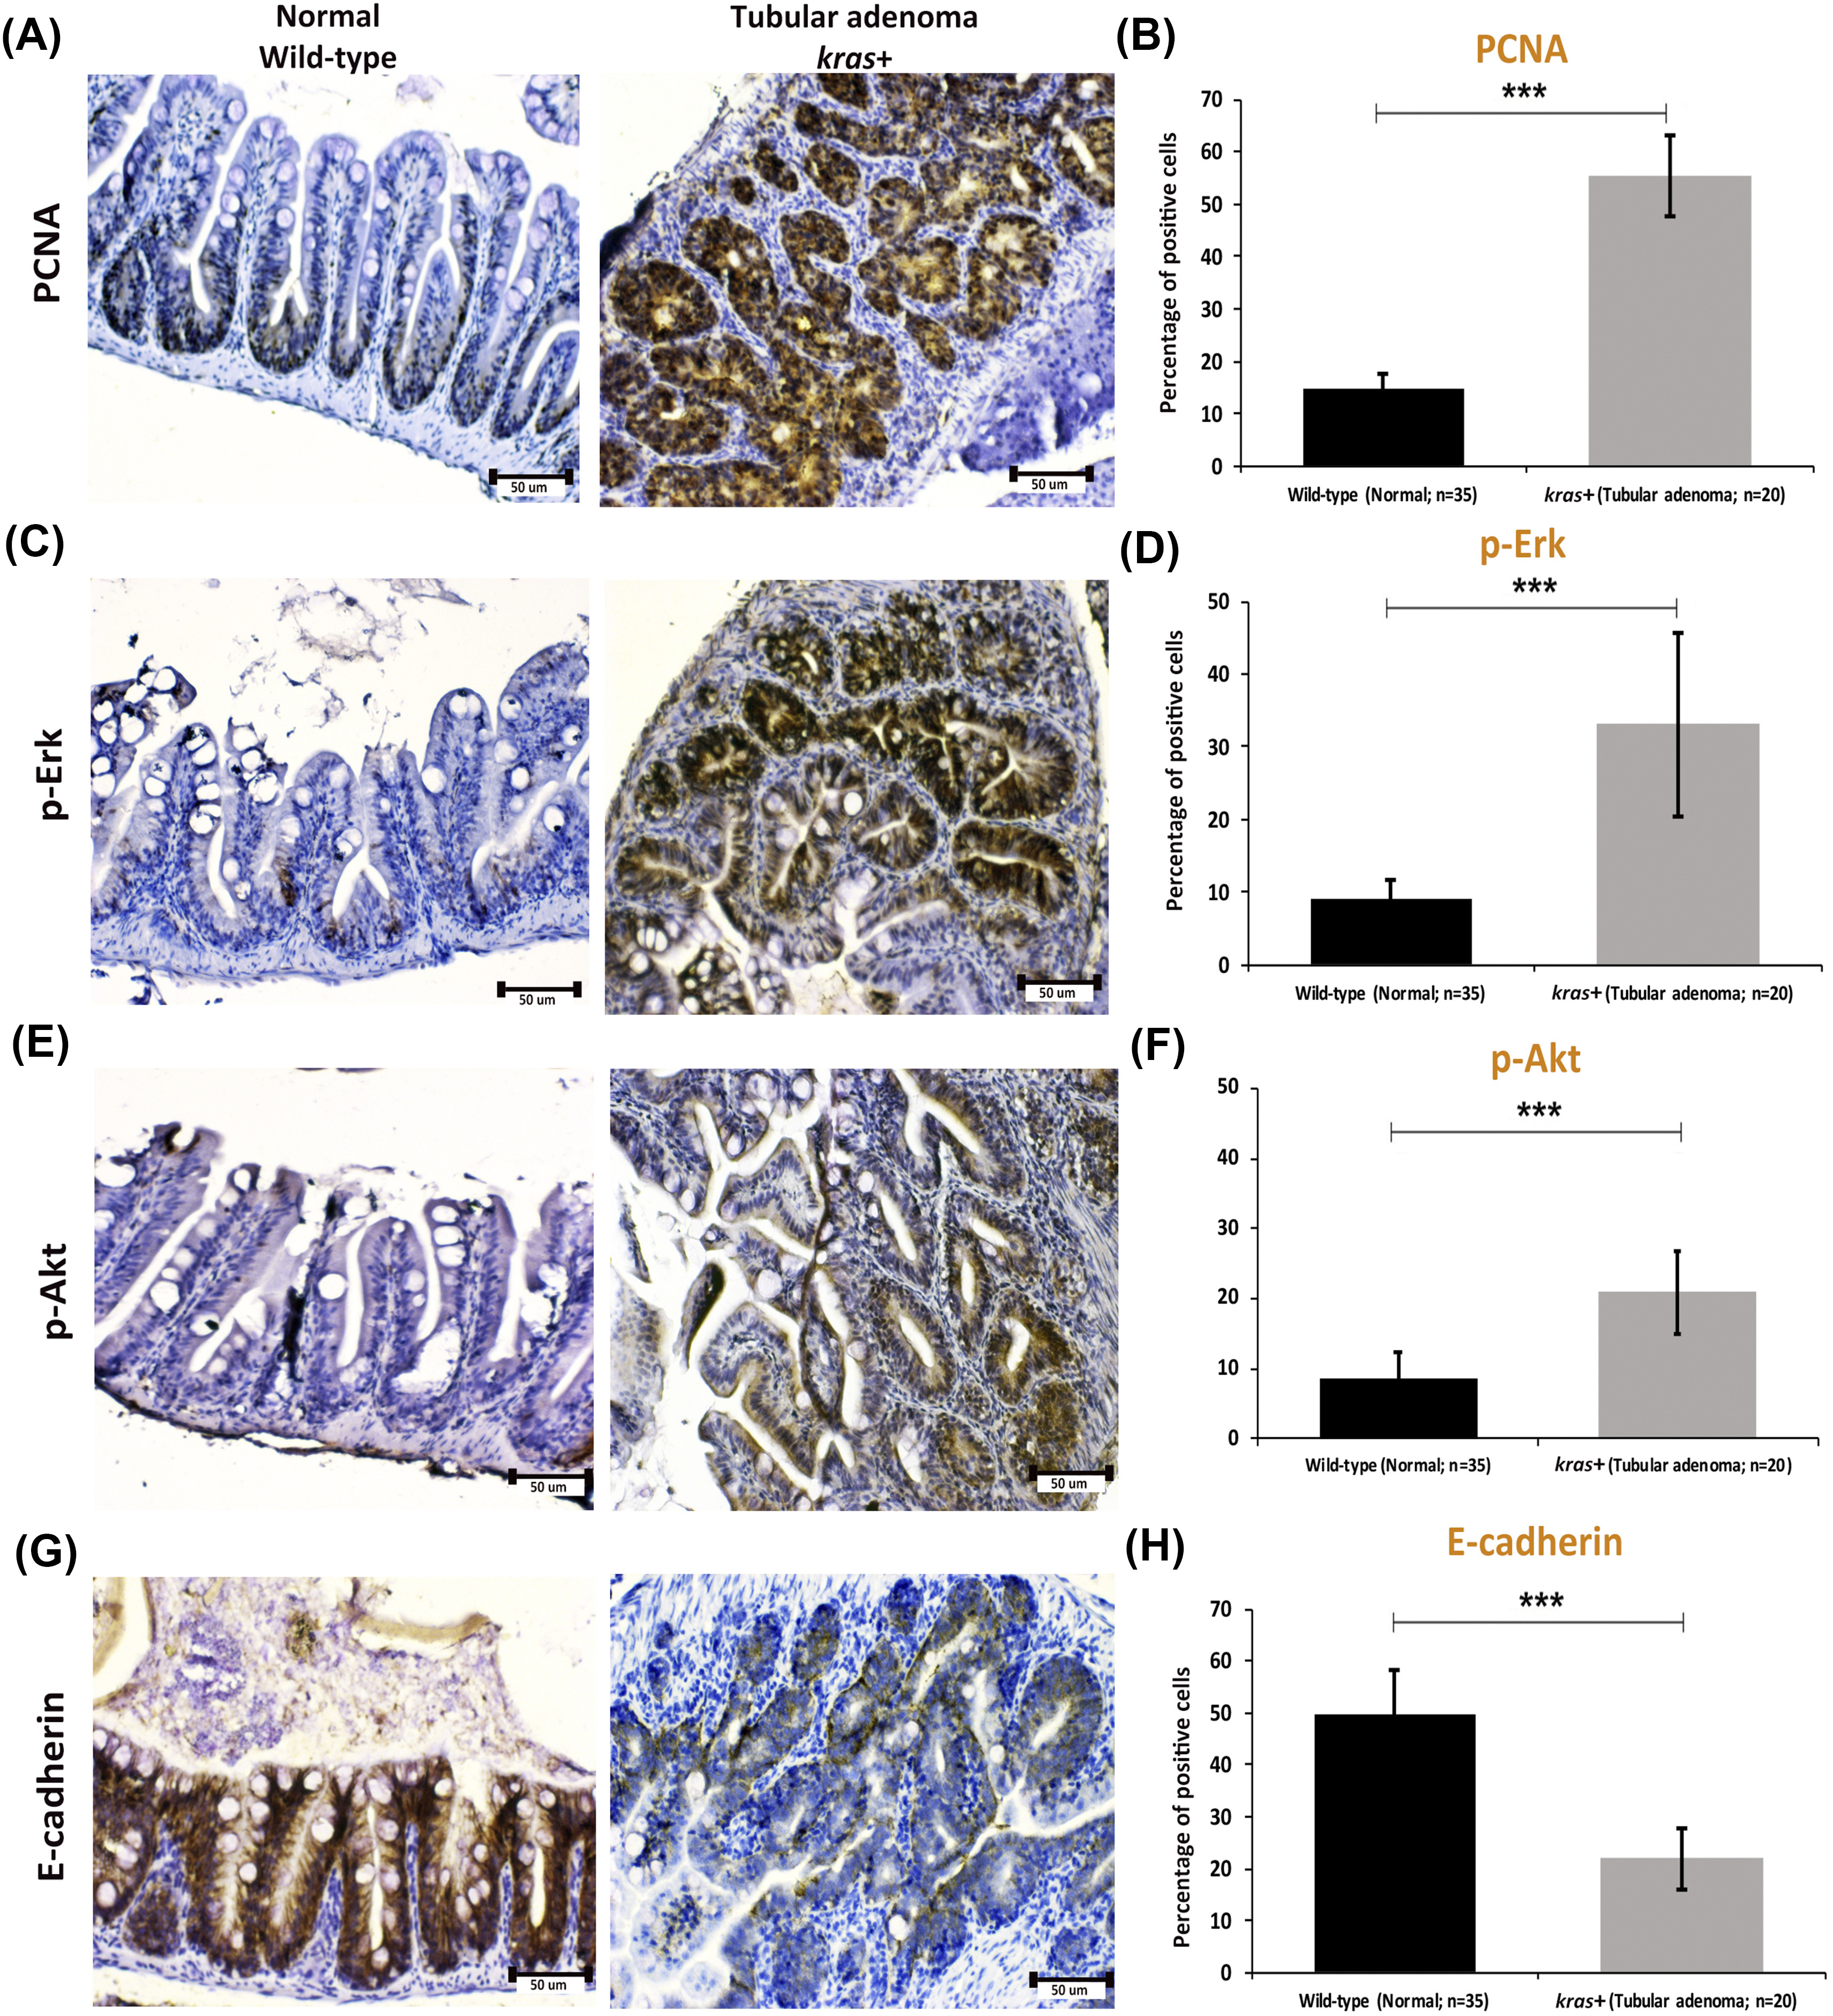
Fig. 4
Immunocytochemical staining of PCNA, p-ErK, p-Akt, and E-cadherin in sections of normal intestine from wild-type fish and tubular adenoma from kras+ transgenic zebrafish. (A and B) Immunostaining of PCNA (A) and quantification of percentages of positive cells (B). (C and D) Immunostaining of p-Erk (C) and quantification of percentages of positive cells (D). (E and F) Immunostaining of p-Art (E) and quantification of percentages of positive cells (F). (G and H) Immunostaining of E-cadherin (G) and quantification of percentages of positive cells (H). Numbers of samples from each group are indicated in the quantification histograms. Statistical significance: ***P < .001.