Fig. 7
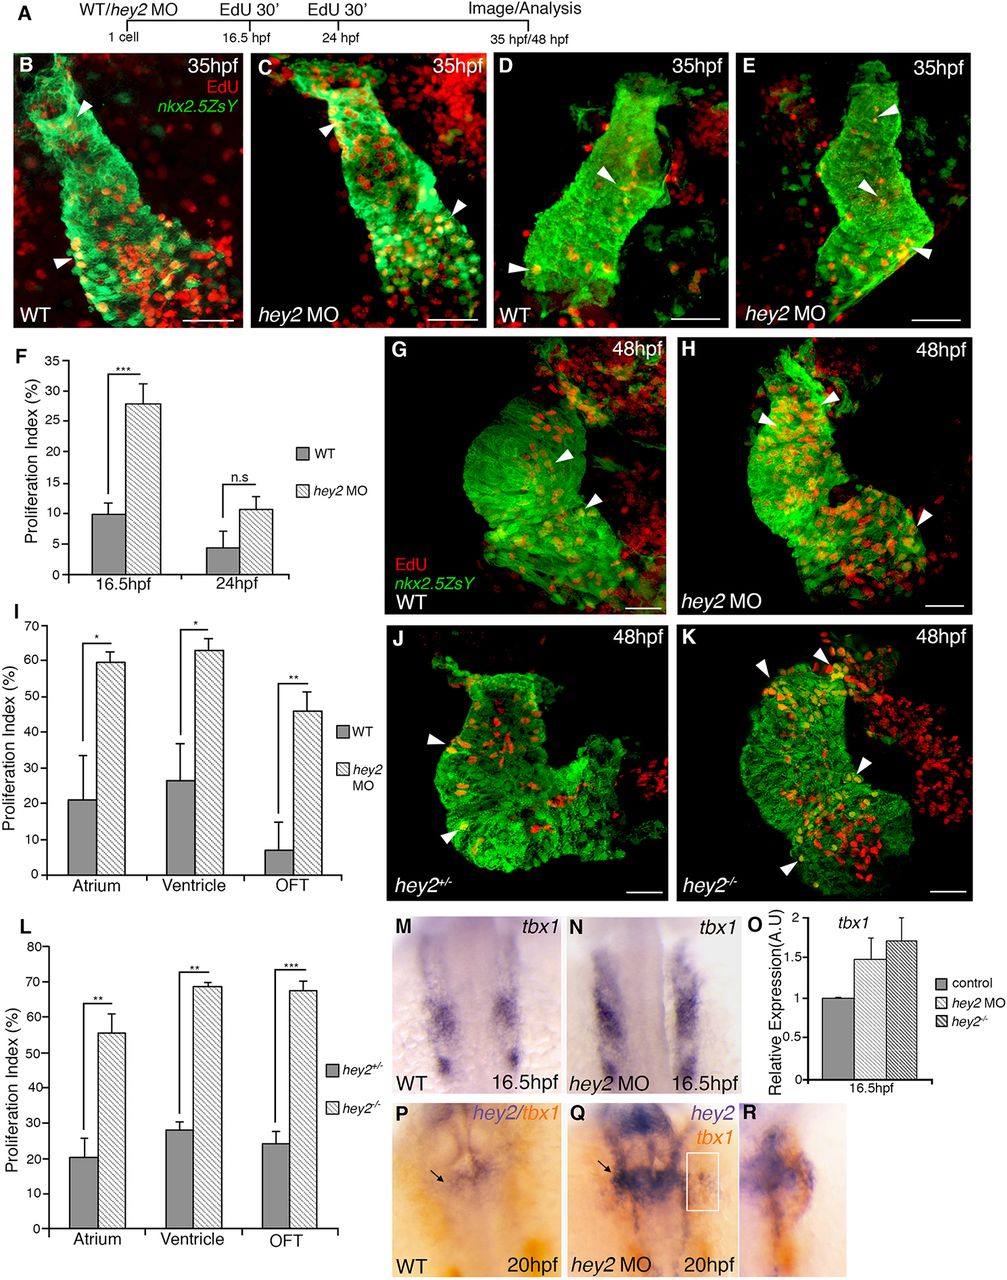
Hey2 inhibits cardiac progenitor cell proliferation during early cardiac development. (A) Schematic of experimental approach for EdU analysis. (B-E) Confocal images of EdU incorporation (red) at 16.5?hpf (B-C) and 24?hpf (D-E) in control (B,D) and hey2 MO (C,E) embryos expressing Tg(nkx2.5:ZsYellow) (green). EdU-positive cardiomyocytes are shown as yellow cells following staining at 35?hpf. (F) Proliferation index at 35?hpf in control and Hey2 morphant embryos following EdU pulse at 16.5?hpf (N=2, n=7) and 24?hpf (N=2, n=4). (G,H) EdU incorporation at 48?hpf in control (G) and hey2 MO (H) embryos following EdU pulse at 16.5?hpf. (I) Proliferation index comparing the number of EdU+ CMs in the atrium, ventricle and OFT between control and hey2 MO embryos at 48?hpf (N=3, n=5). (J,K) EdU incorporation at 48?hpf in hey2 heterozygous (J) and mutant (K) embryos following EdU pulse at 16.5?hpf. (L) Proliferation index comparing the number of EdU+ CMs in the atrium, ventricle and OFT at 48?hpf (N=3, n=14). (M-O) Expression of tbx1 in wild-type (M) and hey2 morphant (N) embryos. Quantitative RT-PCR analysis at 16.5?hpf comparing relative tbx1 expression in control embryos with hey2 morphants and hey2 mutants is shown (O). (P-R) Co-expression of hey2 (blue) and tbx1 (orange) at 20?hpf in control (P) and hey2 morphant (Q, boxed area magnified in R) embryos. Arrowheads highlight EdU+/Nkx2.5+ CMs; arrows indicate hey2+/tbx1+ pharyngeal mesoderm. Scale bars: 20?µm. Data are meanħs.e.m.; *P<0.05; **P>0.01; ***P<0.001. WT, wild type.

