Fig. 3
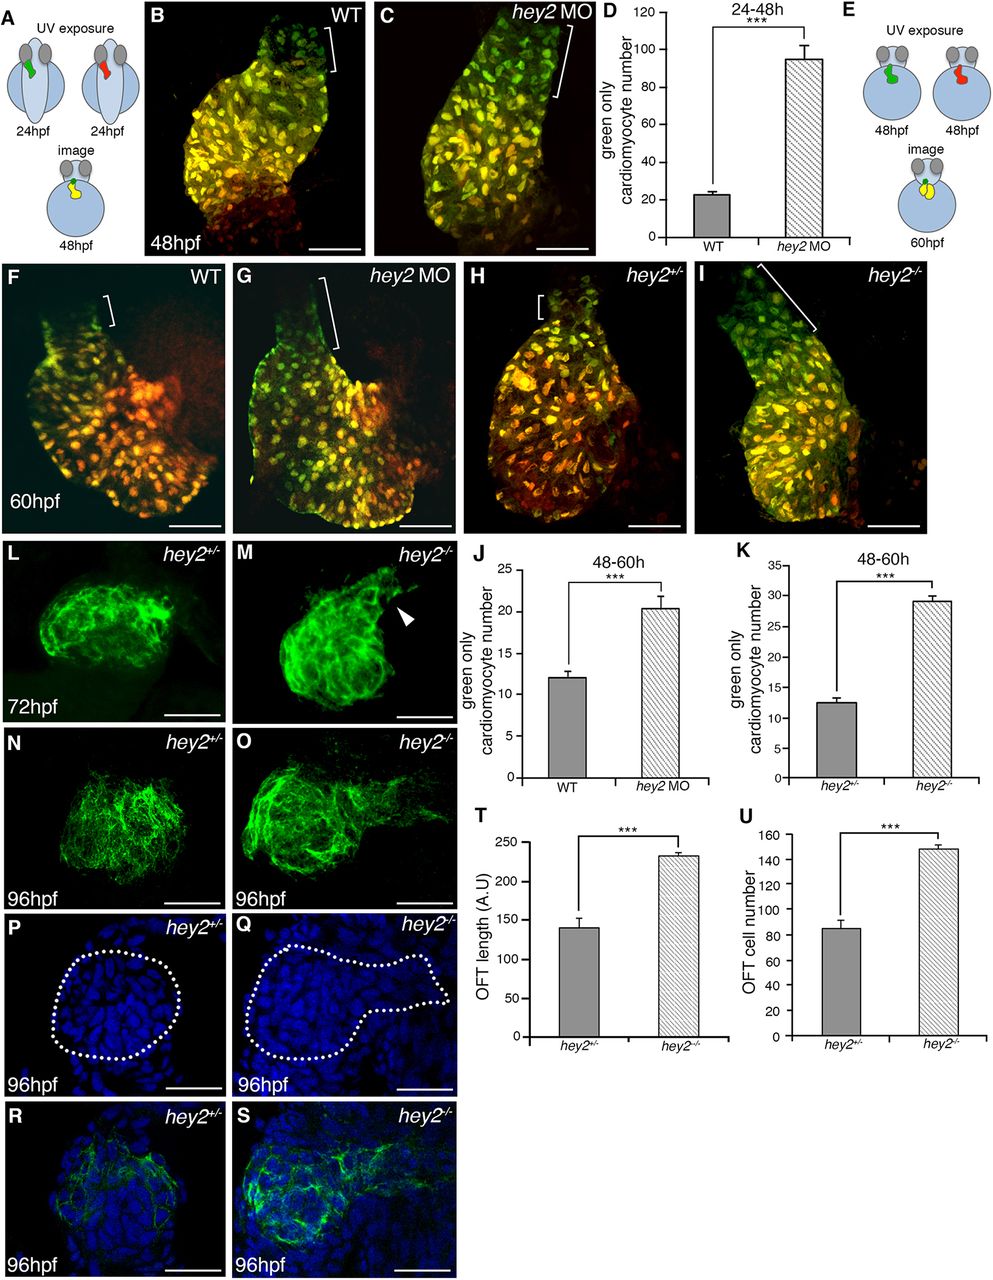
Hey2 restricts late myocardial addition to the heart tube. (A) Schematic representation of cardiomyocyte (CM) photoconversion assay between 24 and 48?hpf. (B,C) Confocal imaging at 48?hpf of control (B) and hey2 MO (C) Tg(myl7:nlsKiKGR) embryos showing cell addition as green-only CMs (bracket). (D) Bar graph showing a significant increase in green-only CMs at 48?hpf in control compared with hey2 MO embryos (N=3, n=7). (E) Schematic representation of photoconversion assay between 48 and 60?hpf. (F-I) Confocal imaging of control (F), hey2 MO (G), hey2?/+ (H) and hey2?/? (I) Tg(myl7:nlsKiKGR) embryos, highlighting cell addition between 48 and 60?h at the arterial pole (bracket). (J,K) Bar graphs documenting green-only CMs at 60?hpf in control and hey2 heterozygotes compared with morphant and mutant embryos (N=3, n=7; N=2, n=8, respectively). (L-O) DAF2-DA labeling of the OFT smooth muscle in hey2 heterozygous (L,N) and hey2 mutant (M,O) embryos at 72 and 96?hpf, respectively. Arrowhead denotes an elongated OFT. (P-S) DAPI labeling of DAF2-DA+ cells at 96?hpf in control (P,R) and hey2 mutant (Q,S) embryos. (T,U) Statistical analysis showing mean OFT lengths (T) and OFT cell number (U) in control and hey2 mutant embryos (lengths: N=2, n=11; cell number: N=3, n=4). Data are meanħs.e.m.; ***P<0.001. Scale bars: 50?µm.

