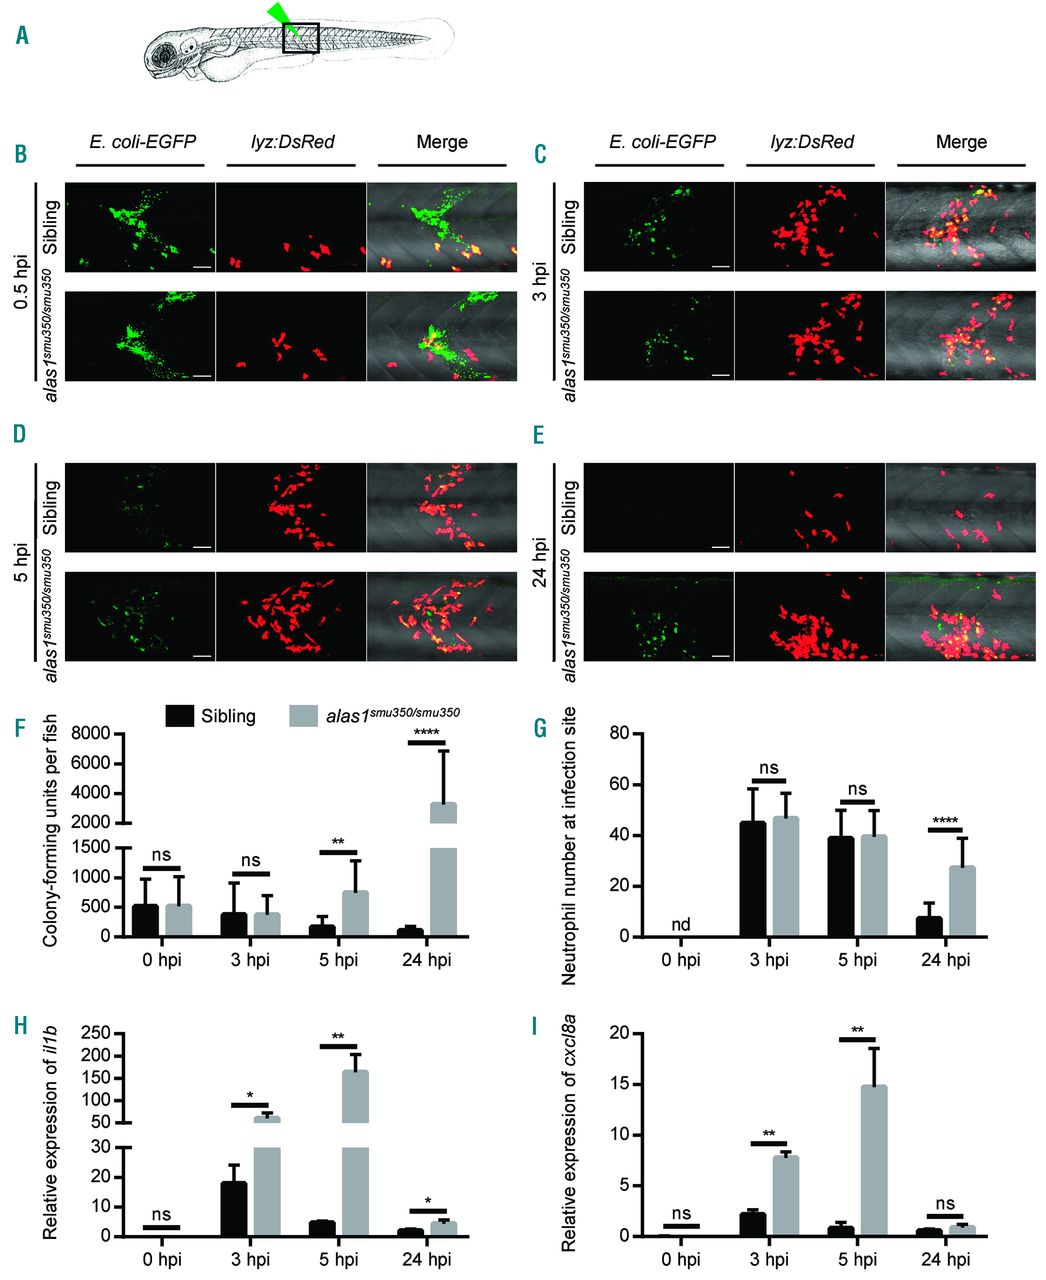
Fig. 6
alas1 deficiency caused impaired host immunity against E. coli infection. (A) Arrowhead indicates the site of bacteria injection. The imaged region is boxed. (B-E) The in vivo behavior of neutrophils against E. coli was monitored by confocal microscopy. eGFP+ E. coli were subcutaneously injected over one somite into 3-day post fertilization (dpf) sibling (upper panels) and alas1smu350/smu350 mutant (lower panels) larva of the Tg(lyz:DsRed) background. Neutrophil behavior was analyzed through live imaging at 0.5 hours post injection (hpi) (B), 3 hpi (C), 5 hpi (D), and 24 hpi (E). All images are maximum-intensity projections from 25 steps × 2 ?m. Scale bars: 50 ?m. (F) Bacterial burden of embryos injected with E. coli. Significantly more bacterial cells were detected in alas1smu350/smu350 mutants (gray column) compared with siblings (black column) at 5 and 24 hpi. MeanąStandard Deviation (SD), n>10 in each group; Mann-Whitney U test: ****P<0.0001, **P<0.01, ns: not significant. (G) Quantification of recruited DsRed+ neutrophils at infection sites in live embryos injected with E. coli. Significantly more neutrophils were observed at the infection sites of alas1smu350/smu350 mutants (gray column) compared with siblings (black column) at 24 hpi. MeanąSD; n>19 in each group; Student t-test: ****P<0.0001. nd: not detectable, ns: not significant. (H) Relative il1b expression assessed by RT-qPCR. il1b expression was up-regulated in alas1smu350/smu350 mutants (gray column) compared with siblings (black column) at 3, 5, and 24 hpi. MeanąSD; n=4 in each group, performed in triplicate. Expression levels were adjusted for trauma [phosphate buffered saline (PBS) injection only]. Statistical significance was determined using Student t-test: **P<0.01, *P<0.05. ns: not significant. (I) Relative cxcl8a expression assessed by RT-qPCR. cxcl8a expression was up-regulated in alas1smu350/smu350 mutants (gray column) compared with siblings (black column) at 3 and 5 hpi. MeanąSD; n=4 in each group, performed in triplicate. Expression levels were adjusted for trauma (PBS injection only). Statistical significance was determined using Student t-test: **P<0.01. ns: not significant.

