Fig. 5
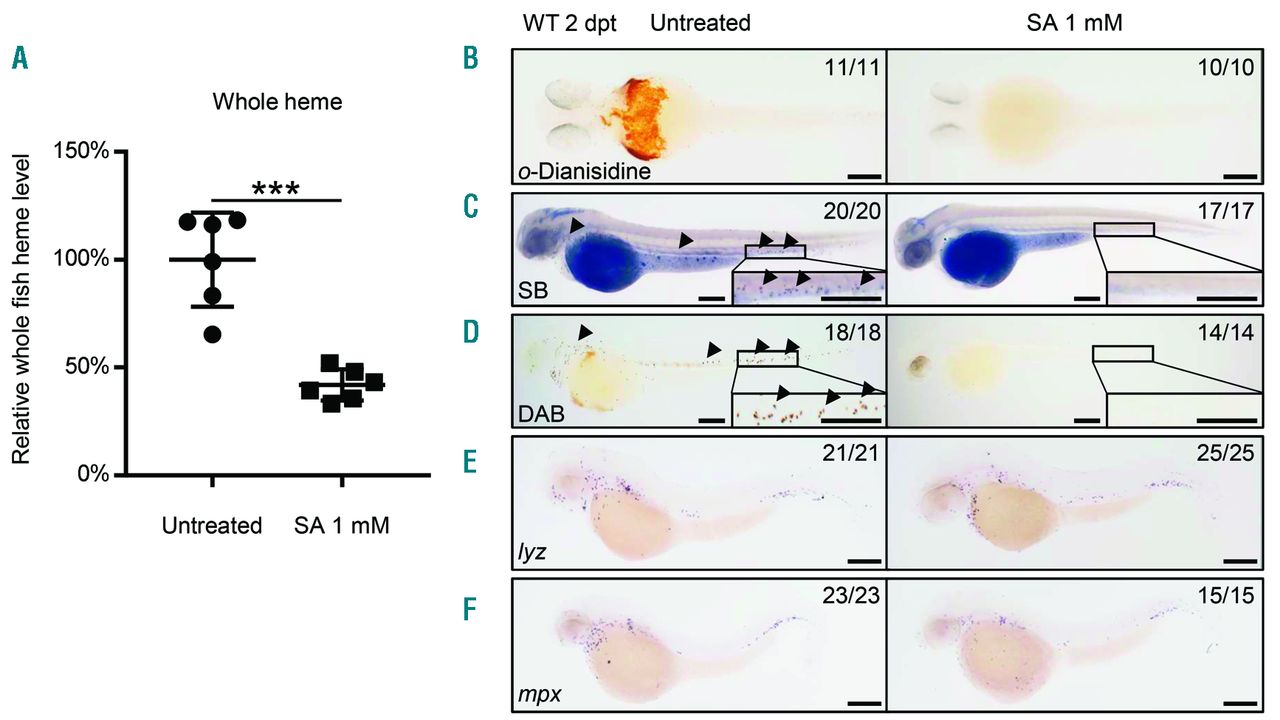
Heme was essential for neutrophil maturation. (A) Whole fish heme levels of succinylacetone (SA)-treated embryos were significantly decreased than those of untreated control. Relative whole fish heme levels in untreated control (circles) and SA-treated embryos (triangles) at 2 days post treatment (dpt). Lines show MeanąStandard Deviation (SD), 6 individual data points in each group, each data point was based on 3 measurements for 5 embryos; Student t-test: ***P<0.001. The relative heme level was normalized to per-fish level. (B) The o-Dianisidine signal was totally absent in SA-treated embryos. o-Dianisidine staining in untreated wild-type (left, 11 of 11 embryos) and SA-treated (right, 10 of 10 embryos) embryos at 2 dpt. (C) The Sudan black B (SB) signal was totally absent in SA-treated embryos. SB staining in untreated wild-type (left, 20 of 20 embryos) and SA-treated (right, 17 of 17 embryos) embryos at 2 dpt. Black arrowheads indicate the neutrophil signals. The boxed regions are magnified in the lower right-hand corner. (D) The DAB signal was totally absent in SA-treated embryos. DAB staining in untreated wild-type (left, 18 of 18 embryos) and SA-treated (right, 14 of 14 embryos) embryos at 2 dpt. Black arrowheads indicate the neutrophil peroxidase signals. The boxed regions are magnified in the lower right-hand corner. (E) WISH of lyz expression in untreated wild-type (left, 21 of 21 embryos) and SA-treated (right, 25 of 25 embryos) embryos at 2 dpt. (F) WISH of mpx expression in untreated wild-type (left, 23 of 23 embryos) and SA-treated (right, 15 of 15 embryos) embryos at 2 dpt. Scale bars: 200 ?m (B-F).

