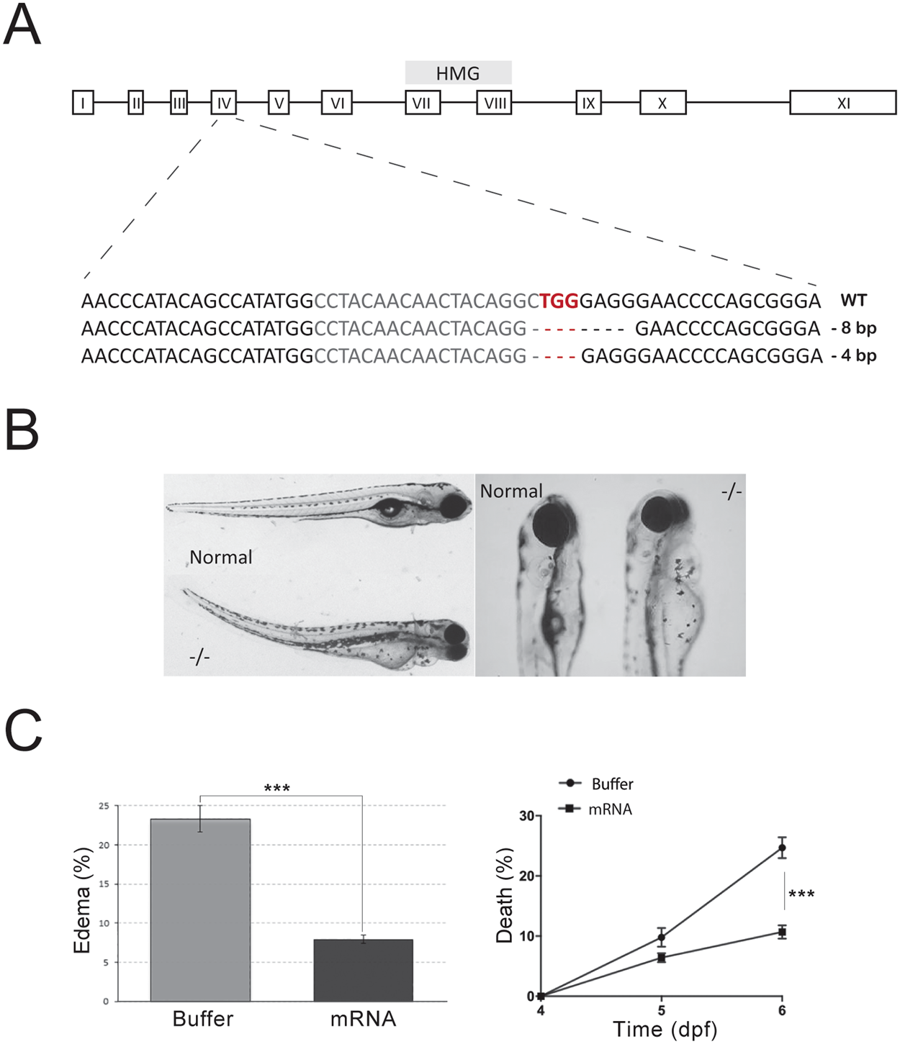
Fig. 1
(A) Schematic diagram of smarce1 gene. The DNA-binding high mobility group is shown. CRISPR/Cas9 mediated-deletions were produced in exon IV. The nucleotide sequence of the RNA-guide targeted region is shown in gray with the PAM in red and the deletions are indicated in lines below. (B) The body curvature, smaller eyes and cardiac edema are shown. (C) Graphs showing rescue experiments with injected smarce1 mRNA. A significant lower number of edematous embryos (left) and a higher survival rate (right) were determined in groups of the mRNA-injected relative to buffer-injected embryos. Values represent the average of three independent injections of 100?±?10 embryos per experiment. ***P?<?0.001.

